

Early November, our research team participated the 3rd Workshop on Visualization Education, Literacy, and Activities during IEEE VIS 2025 in Vienna, Austria. Bringing together researchers and educators from visualization, learning sciences, and related fields, the workshop provided a forum toContinue reading… Presentation @EduVis Workshop in Vienna!
Category: Home
Iterating for Impact: Piedmont Park ASF Event Recap

Following the feedback we received at the Atlanta Science Festival event at Georgia Tech, our team made key improvements to the AQI onboarding prototype in preparation for our second event—this time at Piedmont Park on March 22nd. We focused onContinue reading… Iterating for Impact: Piedmont Park ASF Event Recap
Atlanta Science Festival at Georgia Tech

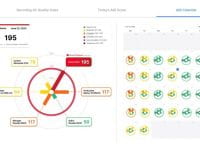
On March 2nd, our team participated in the Atlanta Science Festival at Georgia Tech. We conducted qualitative user testing on the redesigned onboarding screens for introducing the Air Quality Index (AQI). The previous version of the AQI concept kiosk screensContinue reading… Atlanta Science Festival at Georgia Tech
A Framework for Integrating Data Visualization in STEM Education @ GSTA 2025

In this workshop, we will introduce the DPV framework and discuss how to teach with Data Visualization in STEM classrooms Learning Objectives Teachers can have a resource to teach data visualization design within their classroom context Agenda Resources
Data Visualization To Tell Stories Workshop

In this workshop, we will discuss how to use data and data visualization to tell stories. We will learn: ●📑 How can I use data to address a question I’m concerned about? ●📊 How can I create data visualizations withContinue reading… Data Visualization To Tell Stories Workshop
Data Visualization in STEAM classrooms @ STEAM Symposium

In this workshop, we will discuss how to teach with and create Data Visualization in Science classrooms in the software Tableau. Agenda for the workshop Time Agenda Items 10:00 — 11:00 Dataseum VisitPre Survey 11:00 — 11:15 Brainstorm activities forContinue reading… Data Visualization in STEAM classrooms @ STEAM Symposium
Spring 2024 Advisory Board Meeting

The AQI research team had a Spring 2024 Advisory Board meeting on May 10th. Led by Dr. Jessica Roberts, the team presented an overview of the AQI data literacy project, including updates on kiosk development and plans for an upcomingContinue reading… Spring 2024 Advisory Board Meeting
Exhibit @ The Dataseum at Georgia Tech
After several rounds of testing with users, the AQI research team designed and developed the new version of the ContAQT system with the updated the daily AQI chart design. The current ContAQT system simplifies the explanation of AQI calculation processContinue reading… Exhibit @ The Dataseum at Georgia Tech