
The forecast for Tuesday, October 19 at 2 PM EDT (18 UTC Tuesday) to Wednesday, October 20 at 8 PM EDT (00 UTC Thursday) included a dry line from Kansas to southern Texas, a cold front from Kansas down to western New Mexico, and precipitation from Wyoming and Colorado to Eastern Michigan and Wisconsin. Figure 1 shows a progression of the surface data, which is exactly that: data taken at the surface. Surface data can include cold and warm fronts, precipitation maps, high- and low-pressure systems, as well as dry line symbols.
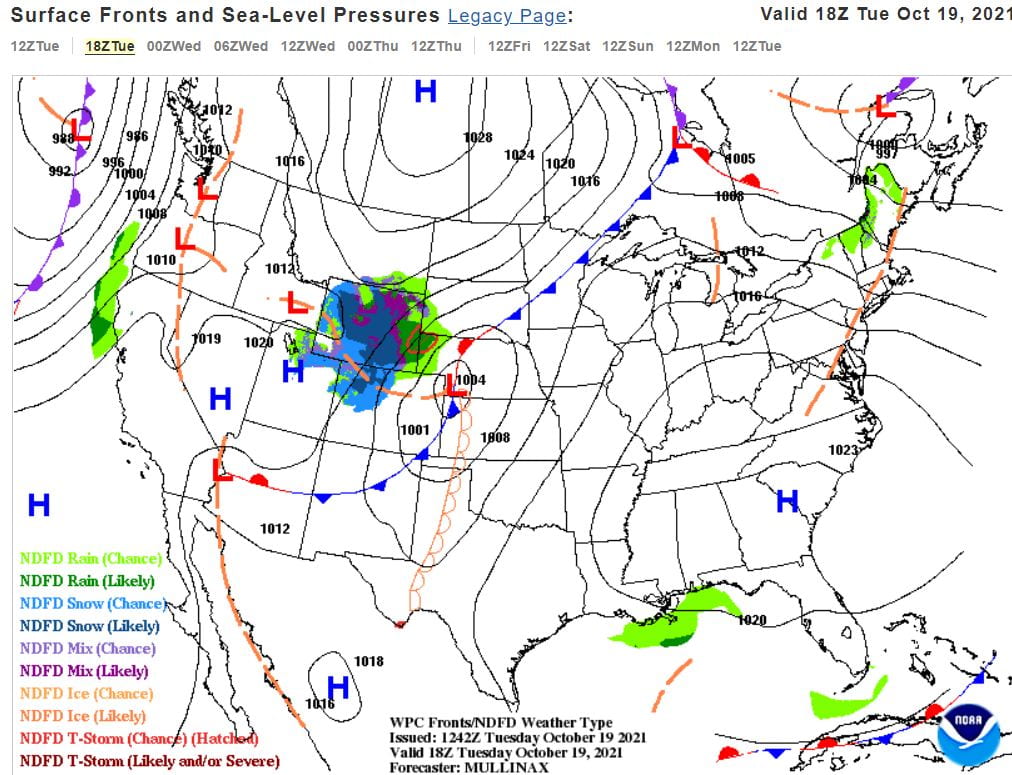


Figure 1: These are forecasted surface data maps from 18 UTC (2 PM EDT) Tuesday, 00 UTC (8 PM EDT Tuesday) Wednesday, and 00 UTC (8 PM EDT Wednesday) Thursday respectively. They show where rain is likely in green shades, high- and low-pressure systems, cold fronts, warm fronts, and dry lines. The main focus of these maps is the low-pressure system that propagates from Nebraska and Kansas eastward into Minnesota and Iowa by the last panel. (https://www.wpc.ncep.noaa.gov/#page=frt )
A cold front occurs when a mass of air that is cooler than the air it is moving towards advances and enters a warmer region. Cold air advection, or CAA for short, happens when colder air is pulled into a region. Through CAA, the cold side of the cold front became cooler and strengthened the front attached to the low-pressure system. (See Figure 2 for a map of CAA progression). The cold front created precipitation as it propagated Eastward by forcing warm, moist air upward, and this can again be seen in Figure 1 under the green shading.


Figure 2: These are forecasted cold air advection (CAA) and warm air advection (WAA) maps from 18 UTC (2 PM EDT) Tuesday and 00 UTC (8 PM EDT Tuesday) Wednesday. The blue represents CAA, the red represents WAA, and the green lines show where fronts are likely strengthening in a process called frontogenesis. (https://www.pivotalweather.com/model.php?p=700tadv&rh=2021102612&fh=loop&dpdt=&mc=)
A dry line occurs when warm air advection (WAA), which is like CAA but with warm air, occurs to the east of a section of drier air. In this case, warm, moist air was forecasted to be advected from the Gulf of Mexico into East Texas. A drier section of air was set up over the Four Corners region of the U.S., and a drastic moisture gradient can be seen in Figure 3. The green, blue, and purple shades indicate higher dew points, and the closer the dew point is to the actual temperature, the moister the air is. The gray and cream colors show low dew points that indicate dry air. Dry lines are capable of sparking severe weather as they force moist air upward and create rain and storms.


Figure 3: These are forecasted dew point maps from 18 UTC (2 PM EDT) Tuesday, 00 UTC (8 PM EDT Tuesday) Wednesday, and 00 UTC (8 PM EDT Wednesday) Thursday respectively. The greens, blues, and purples indicate higher dew points and therefore more moist air. The dryline combines with the cold front to drop dew points all the way from Mexico to Missouri into Iowa by 00 UTC Thursday. (https://www.pivotalweather.com/model.php?p=850td&fh=loop&dpdt=&mc=)
The key difference between a cold or warm front and a dry line is while both temperature and dew points can change drastically with cold or warm fronts, dry lines change the amount of moisture in the air. (It is possible that the temperature increases slightly on the dry side of a dry line. This is because dry air is easier to heat that moist air. The moisture gradient in a dry line is the main thing that changes after it passes though).