Monday, November 15 into Tuesday, November 16 at 1:30 PM EST (19 UTC Tuesday) did not have many mesoscale features of interest at first glance. Upon further investigation, a cold front attached to a low-pressure system was making its way across the Northwestern U.S. This could be seen after looking at both water vapor imagery and the airmass RGB satellite channel. The top image of Figure 1 shows water vapor imagery. The dark gray mass (representing a lack of water vapor) immediately next to the white line in the Northwest (representing a surplus of water vapor and clouds) looked like a dry air mass overtaking a moist air mass. This often shows a cold front is coming into an area. The airmass RGB on the bottom of Figure 1 confirmed this. The rust color is indicative of dry air, and the blue color that soon followed the rust color is cold air (this transition is most clearly seen over California and Nevada).


Figure 1: The top panel shows a snapshot of water vapor imagery at 17:40 UTC (12:40 EST) on 16 November 2021. Darker shades show drier air and white shades show more moist air. (https://whirlwind.aos.wisc.edu/~wxp/goes16/ir13/goes16_namer.html) The bottom panel shows an airmass RGB satellite channel from the GOES 16 geostationary satellite. It looks cluttered but gives a lot of data on airmasses around the U.S. Blue indicates cold air, rust indicates dry air, green indicates moist air, and the purple at the edges is just an error from the curve of the earth. (https://weather.cod.edu/satrad/?parms=continental-conus-airmass-24-0-100-1&checked=map&colorbar=undefined)
Often, cold fronts in the Southeast or Southcentral U.S. will cause some sort of precipitation. This can come in the form of narrow cold frontal rain bands (NCFRs) or wide cold frontal rainbands (WCFRs). NCFRs are caused by forced convection of warm air upward, which causes very heavy rain. WCFR on the flipside have light to moderate rain that is stratiform and follows NCFRs. The short window of time it takes an NCFR to pass is a blip compared to how long WCFRs can stick around. It is a matter of minutes versus a few hours. Figure 2 shows a conceptual model of NCFRs and the WCFRs that follow.

Figure 2: Narrow cold frontal rain bands (NCFRs) come on the leading edge of a cold front. Warm air is forced upward and can cause severe and heady downpours if proper elements (such as CAPE) are in place. Wide cold frontal rain bands (WCFRs) are a steadier, more light to moderate rain that come after the initial NCFR. (https://www.sciencedirect.com/science/article/pii/B9780123742667000111)
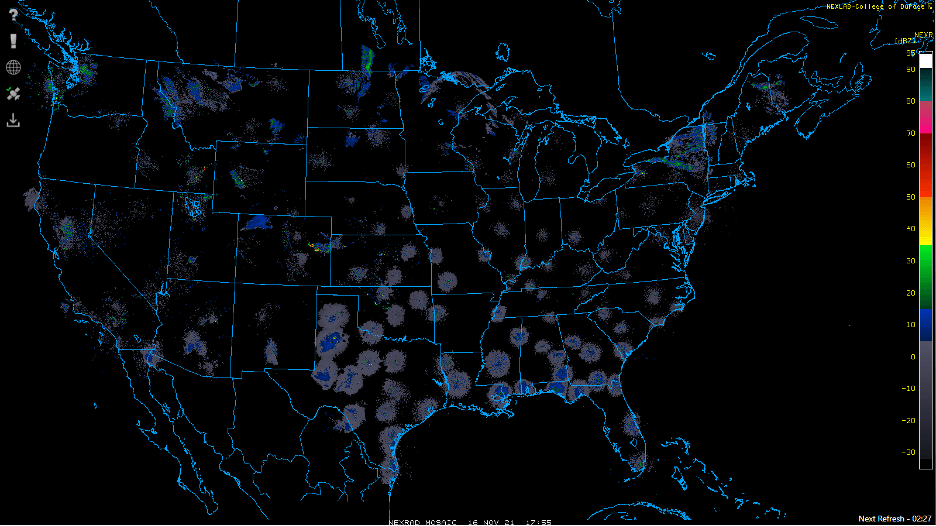
On the days that the cold front was observed over the Northwest U.S., however, there was very little precipitation (See Figure 3 for the radar images on the morning of November 16).

Figure 3: This is a snapshot of radar at 17 UTC (12 PM EST) on 16 November 2021. There is a little backscattering at most radar sites but very little precipitation overall. (https://weather.cod.edu/satrad/?parms=continental-conus-comp_radar-24-0-100-1&checked=map&colorbar=undefined)
What were the reasons for this when cold fronts often bring precipitation? First, the northwestern U.S. is already cool at this time of the year. The cold front coming through will make the region colder, yes, but the air being forced upward now is denser than it would be in the summer. Because the air is cooler, it does not hold as much moisture. Second, precipitable water, or PWAT, was less than half an inch. PWAT measures the amount of water that would come out of the atmosphere if all of it was extracted for an area. Figure 4 shows a map of the PWAT values for Tuesday at 1 PM EST (18 UTC). For precipitation to occur, a general rule requires at least an inch of PWAT and often cases more. The lack of moisture in the air coupled with already cool temperatures in the region led to a lack of precipitation.

Figure 4: This map is a collection of PWAT data over the U.S. on 16 November 2021 at 18 UTC (1 PM EST). The contours show the PWAT measurements, and the fill pattern comes in shades of green if the PWAT meets or exceeds 1”. As seen above, only Western Tennessee and Northern Mississippi had PWAT values above 1”, meaning there was not much moisture in the air at this time. (https://www.spc.noaa.gov/exper/ma_archive/action5.php?BASICPARAM=pwtr.gif&STARTYEAR=2021&STARTMONTH=11&STARTDAY=16&STARTTIME=18&INC=-6)

