‘Tis The Season… for Lake Effect Snow (December 2, 2021) (author: Dorien Minor)

Beginning at the start of December, meteorological winter marks a three-month period through February where temperatures in the Northern Hemisphere are at their coldest. Not surprisingly, winter across a large swath of the United States is associated with much colder temperatures and wintry precipitation in the form of snow, sleet or freezing rain. Across the Great Lakes, the invasion of cold air in late fall and early winter can spell trouble for neighboring communities, as lake effect snow can significantly increase the rate at which snow falls, and as a result, causes a higher annual snowfall compared to other parts of the country aside from the Rocky Mountains and the Cascades. Since 30 September 2021, some communities downwind of the lakeshores have received up to three (3) feet of snowfall, primarily from lake-effect snow, and there is plenty more to come over the next several weeks!

Figure 1: Seasonal snowfall accumulation from 12Z 30 September 2021 to 12Z 2 December 2021, centered over a) Midwest United States, and b) Northeast United States. Source: Pivotal Weather, with derived data plotted from the National Operational Hydrologic Remote Sensing Center (NOHRSC).


Behind a pair of cold fronts associated with a nearby clipper system, lake-effect snow began to fall over portions of northern Michigan on 2 December 2021 and has consistently produced light to moderate snowfall across this region as of 06Z 3 December 2021 (Figure 2). Although this event pales in comparison to the feet of snow that lake-effect events have been known to produce, this example forms under the same conditions. As depicted in Figure 3, lake-effect precipitation, either in the form of rain or snow depending on the temperature, forms when colder air is advected over a relatively warm body of water. With a greater temperature contrast between the surface and air in the lower parts of the atmosphere, the air becomes more unstable, and convection is created. During late winter, lake-effect actually comes to a halt as ice begins to form on the lakes, which prevents evaporation from occurring to the degree needed to cause condensation from lake-effect alone. For lake-effect events, convection manifests itself in the form of horizontal convective rolls (HCRs), or “cloud streets”, as shown on the radar imagery, where small-scale rising and sinking motions along the boundary layer produces rows of clouds and precipitation as opposed to a single convective line.

Figure 2: NEXRAD Base Reflectivity (0.5 deg.) centered over Gaylord, Michigan from 1239Z 2 December 2021 to 0141Z 3 December 2021. Source: College of DuPage.


Figure 3: Conceptual model of lake effect snow over an idealized lake. Source: The COMET Program.


While forecasters use a wide array of tools when predicting winter weather, meteorologists use two main tools aside from the wind direction to determine if and where lake-effect snow will occur: lapse rates and frictional convergence. As previously mentioned, instability arises where there is a sharp temperature contrast between the surface and the air close above. Lapse rates are the perfect diagnostic tool for looking at instability in the lower parts of the atmosphere, as it measures how quickly temperature decreases with respect to height. In Figure 4, lapse rates greater than 5C/km over northern Lake Michigan on 3 December 2021 suggests that colder air was present above the warmer lake surface, which plays a large role in promoting instability. Through an evening sounding on 3 December 2021 in Alpena, Michigan (Figure 5), strong cooling with height are evident in the red temperature profile, in which the air within the lowest kilometer of the atmosphere cools at a rate close to the dry adiabatic lapse rate.

Figure 4: 0-3 km lapse rate (contours, C/km) from 1200 UTC 02 December 2021 to 0900 UTC 03 December 2021, taken in three-hour intervals. Source: NOAA/NWS Storm Prediction Center.


Figure 5: Observed sounding (top left panel) and hodograph (top right panel) data from Alpena (APX), Michigan at 0000 UTC 3 December 2021. Source: NOAA/NWS Storm Prediction Center.


In tandem with strong lapse rates, forecasters also examine convergence along the lakeshores as wind speeds decrease during the transition from a frictionless lake surface to a friction-filled landmass with trees and other obstructions. Similar to the development of thunderstorms, convergence at the surface allows for air to rise, which can then form clouds and precipitation. The fill pattern on Figure 6 shows where the greatest surface convergence occurs, which is also very strong along the northwestern shores of Michigan’s Lower Peninsula. With strong lapse rates and strong frictional convergence across this region, lake-effect snow survived through 3 December 2021 in a pattern that seeks to repeat itself until the lakes freeze over later this winter.


Figure 6: Surface-based total deformation (shading, meters), axes of dilatation (blue bars) and theta (red contours, K) from 1500 UTC 02 December 2021 to 0000 UTC 03 December 2021, taken in three-hour intervals. Source: NOAA/NWS Storm Prediction Center.

Blog Post 2 (author: Laurel Freeman)

Monday, November 15 into Tuesday, November 16 at 1:30 PM EST (19 UTC Tuesday) did not have many mesoscale features of interest at first glance. Upon further investigation, a cold front attached to a low-pressure system was making its way across the Northwestern U.S. This could be seen after looking at both water vapor imagery and the airmass RGB satellite channel. The top image of Figure 1 shows water vapor imagery. The dark gray mass (representing a lack of water vapor) immediately next to the white line in the Northwest (representing a surplus of water vapor and clouds) looked like a dry air mass overtaking a moist air mass. This often shows a cold front is coming into an area. The airmass RGB on the bottom of Figure 1 confirmed this. The rust color is indicative of dry air, and the blue color that soon followed the rust color is cold air (this transition is most clearly seen over California and Nevada).

Figure 1: The top panel shows a snapshot of water vapor imagery at 17:40 UTC (12:40 EST) on 16 November 2021. Darker shades show drier air and white shades show more moist air. (https://whirlwind.aos.wisc.edu/~wxp/goes16/ir13/goes16_namer.html) The bottom panel shows an airmass RGB satellite channel from the GOES 16 geostationary satellite. It looks cluttered but gives a lot of data on airmasses around the U.S. Blue indicates cold air, rust indicates dry air, green indicates moist air, and the purple at the edges is just an error from the curve of the earth. (https://weather.cod.edu/satrad/?parms=continental-conus-airmass-24-0-100-1&checked=map&colorbar=undefined)


Often, cold fronts in the Southeast or Southcentral U.S. will cause some sort of precipitation. This can come in the form of narrow cold frontal rain bands (NCFRs) or wide cold frontal rainbands (WCFRs). NCFRs are caused by forced convection of warm air upward, which causes very heavy rain. WCFR on the flipside have light to moderate rain that is stratiform and follows NCFRs. The short window of time it takes an NCFR to pass is a blip compared to how long WCFRs can stick around. It is a matter of minutes versus a few hours. Figure 2 shows a conceptual model of NCFRs and the WCFRs that follow.

Figure 2: Narrow cold frontal rain bands (NCFRs) come on the leading edge of a cold front. Warm air is forced upward and can cause severe and heady downpours if proper elements (such as CAPE) are in place. Wide cold frontal rain bands (WCFRs) are a steadier, more light to moderate rain that come after the initial NCFR. (https://www.sciencedirect.com/science/article/pii/B9780123742667000111)


On the days that the cold front was observed over the Northwest U.S., however, there was very little precipitation (See Figure 3 for the radar images on the morning of November 16).

Figure 3: This is a snapshot of radar at 17 UTC (12 PM EST) on 16 November 2021. There is a little backscattering at most radar sites but very little precipitation overall. (https://weather.cod.edu/satrad/?parms=continental-conus-comp_radar-24-0-100-1&checked=map&colorbar=undefined)


What were the reasons for this when cold fronts often bring precipitation? First, the northwestern U.S. is already cool at this time of the year. The cold front coming through will make the region colder, yes, but the air being forced upward now is denser than it would be in the summer. Because the air is cooler, it does not hold as much moisture. Second, precipitable water, or PWAT, was less than half an inch. PWAT measures the amount of water that would come out of the atmosphere if all of it was extracted for an area. Figure 4 shows a map of the PWAT values for Tuesday at 1 PM EST (18 UTC). For precipitation to occur, a general rule requires at least an inch of PWAT and often cases more. The lack of moisture in the air coupled with already cool temperatures in the region led to a lack of precipitation.

Figure 4: This map is a collection of PWAT data over the U.S. on 16 November 2021 at 18 UTC (1 PM EST). The contours show the PWAT measurements, and the fill pattern comes in shades of green if the PWAT meets or exceeds 1”. As seen above, only Western Tennessee and Northern Mississippi had PWAT values above 1”, meaning there was not much moisture in the air at this time. (https://www.spc.noaa.gov/exper/ma_archive/action5.php?BASICPARAM=pwtr.gif&STARTYEAR=2021&STARTMONTH=11&STARTDAY=16&STARTTIME=18&INC=-6)

A Quiet Low-Pressure System (author: Jordan Murdock)

Tuesday November 17th, 2021, proved to be an uneventful day in the atmosphere over North America. There were no severe weather reports of any high winds, hail or tornadoes and no severe precipitation seen. However, though a quiet day for most of the United States, the Great Lakes region did receive some light precipitation at 12Z as can be seen in Figure 1a. Above Minnesota there is a low-pressure system that produced snow and is heading east to the Great Lakes. Already present over the Great Lakes is precipitation following a strong cold front that is attached to a low-pressure system over Lake Michigan seen in Figure 1b. Focusing on this low-pressure system, it is set up by the cold front to strengthen and is what led to the precipitation present. Cold, dense air squeezes its way through the warmer, less-dense air, and lifts the warm air. Because air is lifted instead of being pressed down, the movement of a cold front through the warm front led to the low-pressure system and the precipitation in this area.

Figure 1: a. Pivotal weather map from 12Z 17 November 2021 showing rain (green fill), snow (blue fill) and low-pressure systems. b. WPC surface analysis 12Z 17 November 2021 showing the cold front and low-pressure system over the Great Lakes


The 300 mb map in Figure 2 shows a deep level trough over Wyoming at 12Z on November 17th, 2021. At the base of the trough there are light blue fill patterns representing stronger winds that continue northeast along the jet stream towards Wisconsin and the dark purple fill pattern that represents even stronger winds. East of these darker purple fill patterns is a ridge at 300 mb, though it is not as prominent. In between the trough and ridge there are pink contours representing divergence in the atmosphere that is still present even though the ridge is not as pronounced. The strong winds present over the Great Lakes and the Michigan, Wisconsin region along with the upper-level divergence between the trough and the ridge leads to the low-pressure system and the associated cold front.

Figure 2: 300 mb map from 12Z 17 November 2021 showing the jet streak (fill pattern) and divergence (pink contours)


As the low-pressure system strengthens, so does the associated cold front. Figure 3 shows the locations at which frontogenesis takes place, represented by the red contours. Frontogenesis is the intensification of a front when the horizontal temperature gradient amplifies by at least an order of magnitude. This process occurs when a warm air mass meets a cold air mass since a temperature difference is essential in the definition of a front because it implies a density difference. Figure 3 shows frontogenesis located over Oklahoma, Missouri and Illinois following the cold front that attaches to the low-pressure system over the Wisconsin and Great Lakes region. This area of frontogenesis is located in between the trough and the ridge which is the same area as divergence. All these components led to the strong cold front and the attached low-pressure system which resulted in the precipitation, no matter how limited, in the region.

Figure 3: Surface frontogenesis map of 12 Z November 17, 2021 where frontogenesis is represented by the red contours

Southern Plains Cold Front and Storm Chances (author: Thomas Silas)

On November 17, 2021, a surface low pressure system was forecast to be centered in western Ontario, Canada, with a cold front extending roughly along a line from Michigan southwest to northern Texas and New Mexico. This can be seen as the temperature gradient in the 850 mb temperature map below:

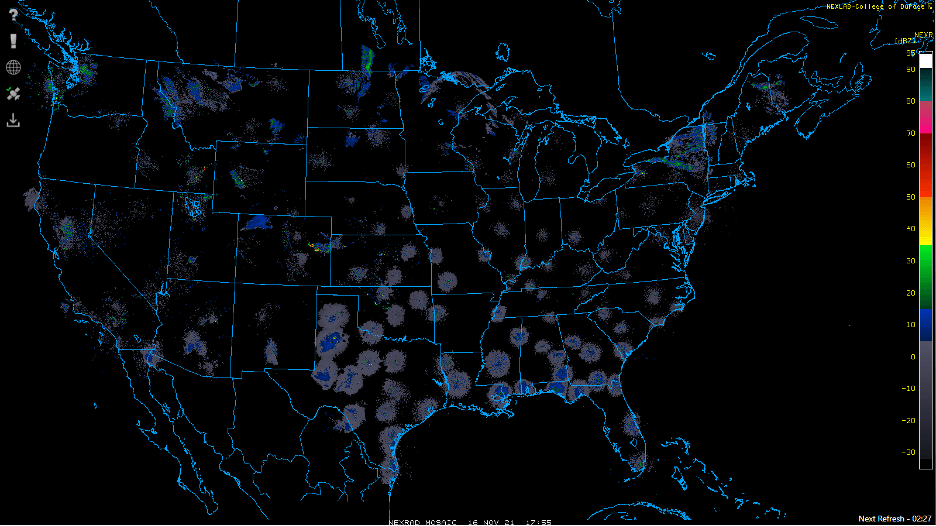
Figure 1: GFS 850mb temperature, height, and wind, initialized 12z 16 November 2021, valid 18z 17 November 2021. (Source: Pivotal Weather)


To analyze what will happen with this front, we can use a parameter called frontogenesis, which essentially determines how the temperature gradient across the front changes with time. The one-dimensional frontogenesis equation contains four terms: shearing, confluence, tilting, and diabatic. The math behind this is fairly messy, but essentially what this reduces down to is if the warm side of the front becomes warmer and/or the cold side becomes colder, frontogenesis occurs as the temperature gradient across the front strengthens. In the case of the front in the 850 mb map above, specifically the portion in northern Texas, winds to the south of the front are out of the west or southwest. This has the effect of advecting warmer air into the region from west Texas. However, to the north of the front, northerly winds are forecast to advect colder air from the northern plains into the region. Since the warm side is getting warmer and the cold side is getting colder, this is a frontogenesis situation. This can be confirmed with the map below, which shows areas of positive frontogenesis over northwestern Texas. Note that the tilting and diabatic terms are not included in this map, since these terms are difficult to calculate and usually are not as significant as the shearing and confluence terms.

Figure 2: GFS 850 mb frontogenesis and temperature, initialized 12z 16 November 2021, valid 18z 17 November 2021. (Source: Pivotal Weather)


To the east of the cold front, winds out of the south were expected to bring warm, moist air from the Gulf of Mexico northward into portions of eastern Texas, Arkansas, and Louisiana. Normally, one might expect showers and thunderstorms to develop in this type of environment. However, in this case, storms were not really forecast to occur due to a lack of instability. This is shown in the model skew-T diagram below:

Figure 3: GFS model sounding, initialized 12z 16 November 2021, valid 18z 17 November 2021. (Source: Tropical Tidbits)


Although temperatures are fairly warm at 79F, the moisture is not particularly impressive for this part of the country with a dewpoint of 57F at the surface. However, the warm temperatures at higher altitudes are the main reason for the stability of this environment. In particular, there is an isothermal or even inverted layer between 850 and 750 mb that acts as a cap to prevent storm activity. Surface based CAPE (instability) values are very small at less than 100 J/kg, with large CIN (inhibition) values of more than -200 J/kg. This suggests that thunderstorms are unlikely, and any that do manage to form should remain weak. The NAM 3km model agrees with this analysis, showing very little activity over this region aside from a narrow region of light to moderate precipitation near and along the cold front.

Figure 4: NAM 3km composite reflectivity, initialized 12z 16 November 2021, valid 00z 18 November 2021.

Low Pressure System Forecasted to Bring Rain and Snow to the Upper Midwest (author: Charlotte Carl)

On November 10th, 2021, at 17Z, I issued a forecast for 2 low pressure systems in the Midwest. As shown in the Weather Prediction Center’s 15Z surface analysis map, one of the systems was 1007 millibars and was centered over North Dakota at the time the forecast was issued, and the other was 1009 millibars and centered over Kansas.

Figure 1: The Weather Prediction Center’s surface analysis map issued at 15Z. The centers of the two low pressure systems are labeled with “L” and are located over North Dakota and Kansas. The 1007 millibar low pressure system over North Dakota has an occluded front, or a warm air mass caught between two cold air masses, branching off to the north and a warm front (a region where warm air is replacing cold air) and a cold front (a region where a cold air mass is overtaking a warm air mass) branching off the occluded front to the south. The 1009 millibar low pressure system over Kansas has a warm front and a cold front branching off the center of the low to the south.


The forecast calls for the low-pressure systems to combine and deepen because of upper-level support and the movement of the surface systems. The warm front and the cold front associated with the combined low are not forecasted to increase in strength significantly, as shown by the frontogenesis forecast in figure 4, however the cold front will provide the lifting mechanism, or method by which air parcels can be lifted vertically in the atmosphere, that will release instability and allow for the creation of thunderstorms. The convergence of the surface winds associated with the cold front, shown with the North Dakota cold front in figure 1 demonstrates not only the wind shift associated with the cold front, but also the directional convergence of winds at the surface that could lead to upward vertical motions. As shown in figure 5, the HRRR model is forecasting a squall line feature, and depending on the strength potentially a narrow cold frontal rainband feature, ahead of where the cold front is predicted to be at 10Z on Thursday. On the northern side of the low in Northern Michigan into Canada, there is forecasted to be snow.

Figures 2-3: Figure 2: GFS Model forecast initialized at 12Z on Wednesday for Thursday at 12Z of 700 millibar geopotential height in decameters and frontogenesis (fill pattern) in degrees Celsius/100km/3 hr. Figure 3: HRRR Model forecast initialized at 02Z on Thursday of 1000-500 millibar thickness in decameters, and reflectivity in the fill patterns (blue-purple spectrum being snow, green-warm spectrum being rain).


There is forecasted to be an intensification of the trough-ridge structure at 500 millibars prior to the surface cyclone’s peak in strength. This can be attributed to the precipitation associated with the system. With precipitation comes latent heat release (heat released when water vapor changes phase to liquid water), and with that comes higher geopotential heights. This will strengthen ridge feature downstream and by extension the trough upstream. In the strengthening of the trough and ridge, the divergence between the ridge downstream and the trough upstream increases in strength. This situation is termed cyclone self-development as the cyclone itself is intensifying the features that in turn strengthen the cyclone. The cyclone will reach its peak in strength approximately 24-36 hours from when the forecast was issued. This is due to dynamical mechanisms such as the westward tilt with height of the system, supporting the strengthening and combination of the two low-pressure systems. Subsequently, the dynamics will weaken and prevent optimal alignment for maintenance of the system in the upper levels.

Hail and Strong Winds ahead of Oklahoma Surface Low and Southern Cold Front (author: Susan Harrison)

At 2100z on 10 November 2021, there were three surface low pressure centers along the Southern Plans and Texas with a cold front pushing cool dry air eastward from the desert and mountainous terrain of the western US. The warm side of the cold front has southeasterly winds from the Gulf of Mexico moving onto land from the warm side. Figure 1 shows a cold front extending through central Kansas, Oklahoma and western Texas. Due to differences in the moisture between the airmasses on either side of the front a dryline feature can be seen extending from the Texas-Oklahoma boarder south to Mexico.

Figure 1. shows a surface analysis of the contiguous US at 2100 UTC 10 November 2021. It shows a cold front extending vertically across the US and a dryline feature ahead of the cold front in central Texas. Source: NOAA WPC Surface Analysis Page


As this cold front progresses eastward, it acts as a lifting mechanism, forcing warm moist air upward into higher altitudes. If there are sufficiently large lapse rates along the warm side of the cold front, an environment favorable for the formation of large Convective Available Potential Energy (CAPE) is likely to develop. Figure 2 shows significant lapse rate values over the Texas-Oklahoma boarder, extending southward into central Texas and northward throughout Oklahoma. Regions of large CAPE values and large lapse are great environments for thunderstorms and hail to develop as the forcing of a warm moist air parcel is cooled at a rate quick enough to condense and freeze water vapor before it falls back to the surface.

Figure 2. is a map showing mid-level lapse rates at 2100 UTC 10 November 2021. Values are shown along contours. Higher values are shown with warmer colors. Source: SPC Mesoanalysis Archive


Large CAPE regions are seen vertically throughout central Texas, through Oklahoma, and northward onto Kansas and Missouri. These high CAPE values above 1000 J/kg are seen throughout the entire southern part of the warm side of the cold front as it passes through the Southern Planes region and continues eastward. The significant lapse rates, CAPE values and presence of moist air over Oklahoma were significant to produce hail and significant winds as reported on the SPC Storm Reports page for 10 November 2021.

Figure 3. is a 100 mb map showing mixed layer CAPE values. Shaded fill regions indicate CIN values and red contours are CAPE. Wind barbs are bulk shear in knots. Source: SPC Mesoanalysis Archive

Inversion Layer over Texas on November 2 (author: Jordan Murdock)

On November 2nd, 2021, no severe weather was present in the southwestern United States, but there were some features that lead to an environment suitable for possible severe weather conditions. Figure 1 shows a strong cold front coming from New Mexico eastward across Texas as well as the formation of a dryline. Drylines separate regions of cold and warm air. This dryline is not very prominent, however there is still a significant temperature change at 09Z between the cold, dry air in the high 40s heading eastward from the Rockies and the warm, moist air in the mid-50s coming from the south off the Gulf of Mexico. Figure 1a shows that as the cold front moves east, the dry line shrinks. At this same time there is the formation of a low-pressure system near Odessa, Texas.

Figure 1: a. WPC surface analysis 09Z 02 November 2021 b. WPC surface analysis 12Z 02 November 2021


Typically, when a low-pressure system is present in a region it leads to severe weather features such as high winds and often precipitation. Figure 2 shows a sounding from the MAF station, located in between Odessa and Midland, Texas, that shows there is also a lot of convective available potential energy or CAPE in this region. CAPE describes the instability of the atmosphere and how much energy is available for a developing thunderstorm. Since there is CAPE present, the environment is unstable and suitable for thunderstorms and other severe weather. The dew point temperature (51) is also very similar to the environment temperature (55) so the air is moist and suitable for severe weather to occur since severe thunderstorms are more likely when surface dewpoint is 55 degrees F or higher. However, right below the 850 mb layer there is an inversion seen in the sounding which is what has led to the lack of precipitation or storms in the Texas region. This capping inversion is where temperature increases with height instead of the typical situation where temperature decreases with height. So even though there is a lot of CAPE at higher altitudes in this area, the inversion layer stops it from affecting the surface.

Figure 2: 12Z November 2021 sounding from the MAF station located in between Odessa and Midland, Texas. The green line represents the dew point temperature, the red line represents the environment temperature, and the red dotted line is the parcel path showing the CAPE.


The higher dewpoint values can also be seen at the 850 mb level. In Figure 3 the regions of green show higher dewpoint values. Looking between 09Z and 12Z there is an increase in dewpoint temperatures which corresponds to the low-pressure system and an increase in instability in the area. Although there is no severe weather in the area currently due to the inversion layer, if there is daytime heating or some other factor that would increase the surface temperature, then severe weather has all the necessary components to occur.

Figure 3: 12Z November 2021 850 mb map showing the dewpoint values in the green areas


An inversion layer is also associated with a shallow cold front. As seen earlier in Figure 1, there is a strong cold front that moved east across Texas, contributing to instability of the environment by allowing upward vertical motion. Low-pressure systems form through upward vertical motion and divergence aloft. Often times these processes come from the jet stream at 300 mb. However, when looking at the 300 mb map in Figure 4 the jet streak, which is the filled light blue area, is up near the northeast region and therefore has no real impact on the Texas and southwestern area. The main contributing factor to the low-pressure system forming then in this scenario is the upward vertical motion associated with the strong cold front that has upward motions along it due to the colder air forcing the warmer air upward.

Figure 4: 12Z November 2021 300 mb map showing wind speed(knots) in the fill pattern and divergence in the purple contours

A Brief Dryline Moves Over the Panhandle of Texas (author: Charlotte Carl)

As of 3Z on Tuesday November 2nd, a 1032 mb high was dominating the Midwest and great plains. As a result of this high pressure, there is anticyclonic motion around the feature, which was causing a cold front that was stagnant over Texas to progress southeastward. A cold front is a weather feature where a mass of cold air pushes a warm air mass preceding it up and over itself and cools down the warmer region ahead.

A dryline is a surface weather phenomenon that occurs when warm, moist air from the Gulf of Mexico is advected, or transported, into a region and is met with cooler, drier air that is advected from the Rocky Mountains or the Desert Southwest. The dryline in Texas that appears on the surface weather map (Figure 1) at 03Z issued by the Weather Prediction Center was likely a result of the natural dewpoint gradient between Texas and New Mexico and the dry, cool air advected by the cold front that propagated southward because of the high-pressure system.

Figure 1: Weather Prediction Center surface analysis map issued at 03Z. The dryline is located over the panhandle of Texas and is represented by the orange lines with the empty semicircles branching off the solid orange line.


Ahead of the dryline in Del Rio, Texas (Figure 2) is an example of an elevated mixed layer on a sounding, skew-t plot. An elevated mixed layer separates a moist layer of air at the surface from a layer of dry air aloft. There is also an area separating the moist layer from the dry air aloft called a capping inversion which is an area in the atmosphere where the air is extremely stable, and the temperature increases with height. The elevated mixed layer occurs before the dry line passes because of the transportation of dry air eastward.

Figure 2: Skew-T Plot (Sounding) from Del Rio, Texas at 12Z on November 2nd. The components of the elevated mixed layer (EML) are highlighted with different colored boxes. The orange box is moist layer, the red box is the capping inversion, and the blue box is the dry air aloft – the environmental temperature is parallel to the adiabat (blue line).


At 15Z on November 2nd, 2021, I issued a forecast on the dryline event. Based on the GFS dewpoint forecast from 12Z on November 2nd, the dryline was not expected to exist further than 6 hours into the future (18Z on November 2nd). Between 12Z and 15Z, the dryline disappeared, as on the 15Z Weather Prediction Center surface analysis, the dryline was no longer plotted (Figure 3). As the cold front continued to move through Texas, based on the forecast from Tuesday November 2nd, there was potential for pop up thunderstorms. The cold front would provide the necessary lifting mechanism for the air parcels, allowing for the formation of thunderstorms. Additionally, as shown in Figure 2, there is also sufficient vertical wind shear, the change in both wind direction and speed with height. A shear profile, like the one in Figure 2, promotes the formation of thunderstorms in combination with a lifting mechanism – in this case, the cold front.

Figure 3: Weather Prediction Center surface analysis map issued at 15Z on Tuesday November 2nd in 2021. The dryline over Texas is no longer plotted.

Mesoscale Meteorology Weather Discussion blog post (author: Susan Harrison)

Throughout the morning on the 26th of October 2021 storm conditions developed throughout the Great Plains region of the US. A midlatitude bomb cyclone was present in the Eastern Pacific off the Washington State Coast and brought heavy precipitation to the West Coast throughout the day on Monday. As the associated low-pressure system was carried eastward onto land by the jet stream throughout the latter half of Monday the 25th of October and into Tuesday, upward vertical motion over the lower midlatitudes were played a part in the convective activity explaining heavy precipitation which developed over the Great Plains on Tuesday. Diverging winds are characteristic along the downwind side of a western trough and are responsible for lowering pressures and acting as a lifting mechanism for parcels of air to cool and create stormy conditions and increased wind speeds.

Figure 1. shows windspeeds and vertical motions at 300 mb present on 1200 UTC 26 October 2021.


The rising air from this divergence could explain the convective event which stirred up over the Colorado – Wyoming, Wyoming – Nebraska – South Dakota boarders as seen in figure 2 as lapse rates between 700 mb to 500 mb increase from 0000 26 October to 0008 26 October. The increase in lapse rate value means that air temperature is falling with the rise in altitude at an increasing rate. When the lapse rate is high in one area with respect to the surrounding locations, there is a greater probability of developing CAPE, a key indicator for the development of a storm system.

Figure 2a.

Figure 2b.

Figure 2a and 2b. show the development of lapse rates over the Great Plains on 0000 UTC 26 October 2021 and 0008 UTC 26 October 2021.


Another observation map can be used to help explain how this storm originated and was carried out by the surface to 6km shear vector values. Along Colorado and Wyoming at 1200 UTC 26th October 2021, there was a shear wind value of 90 knots, which can be seen in figure 3. Higher values for the surface to 6km shear vector map can indicate high wind speeds. For this case there were strong speed shear values and minimal directional shear, however this is still a good indicator for the development of strong winds and convective activity which could lead to storm conditions and tornados.

Figure 3. shows vector shear values (kts) for the surface to 6 km along the continental US. Focusing on the West and Great Plains, a troughlike feature carries strong shear values, representing potential for convective activity, thunderstorms, and strong wind speeds.

More Dryline Activity in the Southern Plains (October 26-27, 2021) (author: Dorien Minor)

The month of October 2021 has proven that drylines are not to be ignored in the fall months, although such features are most common and most intense in the spring and early summer seasons in the Southern Plains. Following the pattern of many recent severe weather outbreaks, the outbreak of October 26-27, 2021 featured a series of tornadoes alongside several damaging wind and hail reports. While not as rare as the event on October 12, 2021, this recent outbreak prompted the Storm Prediction Center (SPC) to issue categorial convective outlooks with an enhanced risk (level 3 of 5) for much of the Southern Plains and Louisiana across both days (Figure 1).

Figure 1: NOAA/NWS Storm Prediction Center (SPC) categorial outlooks and verification issued at 13Z for a) 26-27 October 2021, and b) 27-28 October 2021. Source: NOAA/NWS SPC Convective Outlooks.


On the evening of 26 October 2021, a weakening surface low moved eastward into northeastern Colorado, and eventually followed the Nebraska-Kansas border by the beginning of the overnight hours (Figure 2). In addition to the well-defined cold and warm fronts, this feature also has a rather sharp dryline, which separates moist air originating from the Gulf of Mexico from continental drier air. Unlike cold fronts and warm fronts, however, there is no significant change in temperature across the boundary; in fact, temperatures on the drier side are up to five degrees F warmer than on the moist side due to greater heat capacities found on the drier side. Like a cold front or warm front, there is a noticeable wind shift in which southerly to south-southeasterly winds east of the dryline are somewhat colliding with westerly winds west of the dryline. Since colliding air cannot all stay at the ground, increasing convergence will make for a sharper dewpoint contrast, which helps to lift air, and eventually will form thunderstorms along the boundary. This event was a classic example of this process, in which a quick collision of airmasses helped to spark thunderstorms during the evening and overnight hours across the Southern Plains (Figures 3 and 4).

Movie Link: Minor_Blog1_Fig2

Figure 2: WPC surface analysis from 21Z 26 October 2021 to 06Z 27 October 2021 using three-hour intervals and selected station plots. Source: National Weather Service Weather Prediction Center (WPC) Surface Analysis Archive.


Figure 3: Loop of GFS forecasted surface dewpoint over the U.S. Southern Plains from 00Z 27 October 2021 to 06Z 27 October 2021 using three-hour intervals. Dewpoint (in F) is shaded using bottom scale, and 2m wind speed is denoted with black wind barbs. Source: Pivotal Weather.


Figure 4: Infrared satellite imagery centered over southern Oklahoma from 2241Z 26 October 2021 to 0831Z 27 October 2021. Colder (taller) cloud tops are marked with warmer shading using the top left scale. Source: GOES-R.


Once the initial convection fired off, other factors are needed for thunderstorms to become severe: moisture (found on the moist side of the dryline), instability (marked by higher CAPE), lift (along and ahead of the dryline), and wind shear. When there is strong wind shear present in a thunderstorm environment, the updraft will remain separate from the cooler downdraft of a thunderstorm, which helps to sustain and strengthen a thunderstorm. Between the surface and six (6) kilometers above the surface, wind shear speeds greater than 35 knots (40 mph) are usually associated with supercells and possible tornadoes. Figure 5 confirms strong vertical wind shear at the time storms began to fire along the dryline, albeit with higher shear values behind the thunderstorms, which allowed initial convection to become supercells – one of which produced an EF1 tornado close to the University of Oklahoma.

Figure 5: Loop of GFS forecasted surface to 500mb bulk shear over the U.S. Central Plains from 00Z 27 October 2021 to 12Z 27 October 2021 using three-hour intervals. Bulk shear (in knots) is shaded using bottom scale. Source: Pivotal Weather.


Figure 6: Loop of GFS forecasted 850 mb winds over the U.S. Central Plains from 00Z 27 October 2021 to 12Z 27 October 2021 using three-hour intervals. Wind speeds (in knots) is shaded using bottom scale. Using average surface winds from Figure 2, 0-1km wind shear can be approximated as 20 knots lower than forecasted 850 mb wind speeds. Source: Pivotal Weather.