
At first glance, the weather across the United States appeared quiet on 14 April 2021. However, a blip over southern Texas and Louisiana caught my eye. A few convective storms seemingly appeared out of nowhere. Figure 1 shows visible satellite imagery of this event. The storms bubble up rapidly around 2200 UTC 14 April 2021, with the peak convective activity located just east of Houston, Texas. Storms suddenly taking shape like this is often a signature of the influences of diurnal heating. This lines up well with the timeline of these storms, as they took shape right around sunset. The intensity of the storms is evident by the overshooting cloud tops seen on this visible satellite imagery. The overshooting cloud tops are a result of rapid upward vertical motions that cause the clouds to extend into the lower stratosphere. A severe thunderstorm warning was issued by the National Weather Service in association with these storms, further verifying what is seen on visible satellite imagery.
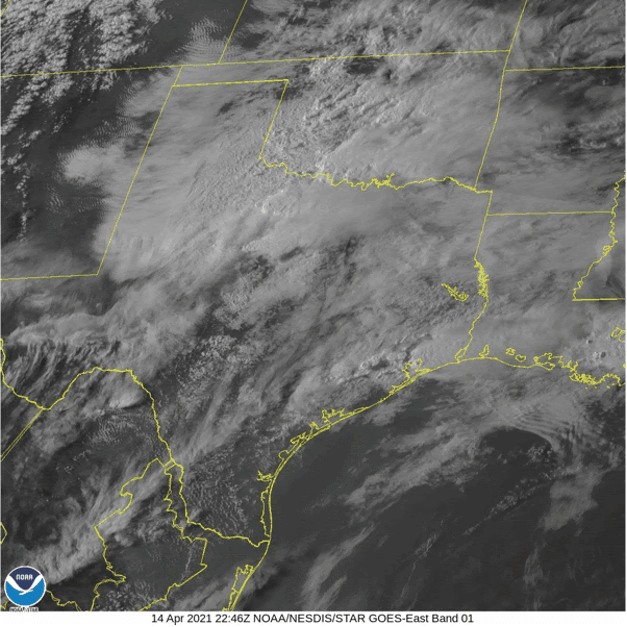 Figure 1 Visible satellite imagery from GOES-East, valid beginning 2200 UTC 14 April 2021 (5pm local time). The cloud cover is shown in the white/light grey, depending upon the thickness of the cloud cover. Land can be seen through the clouds in dark grey.
Investigation of water vapor imagery can allow for analysis of the moisture available with this rapidly developing system. Figure 2 shows the GOES upper-level water vapor imagery beginning around 2200 UTC 14 April 2021 (5pm local time). Water vapor imagery can show locations of the jet stream and jet streaks, and we can deduce some synoptic-scale influences from this. The jet stream is located on water vapor imagery by locating regions of brightness gradient of the white coloration. In Figure 2, the jet stream is located south of Florida, with increasing intensity off the coast. The high level of moisture in the vicinity of the convective cells is evident by the green coloration over eastern Texas and southern Louisiana. This indicates that plenty of moisture was present to fuel the rainfall in association with these cells. The location of the jet stream is removed from the direct vicinity of the convective activity, but there might be some influences from upward vertical motions associated with the right jet entrance region as this jet streak moves toward the Gulf coast of Florida.
 Figure 2 Upper-level water vapor imagery, valid beginning 2200 UTC 14 April (5 pm local time). Moist airmasses (with high water vapor concentration) appear in the shades of green. Dry airmasses (with low water vapor concentration) appear in shades of yellow. Land cover can be seen through the airmasses in blue.
The locations of the moist and dry air masses are verified by looking at Airmass RGB imagery, shown in Figure 3. On this satellite imagery, the warm, moist air mass can be seen by the green coloring. Dry air is shown in orange, and lower stratospheric air (indicating the location of the jet stream) is shown in dark orange. Cloud top temperatures are shown by the white regions. There is a warm, moist air regime over much of the Southeast. The developing convection is shown clearly by the intense white coloration of the cells popping up. There is a dry streak over the Gulf of Mexico, indicating a jet stream signature in the vicinity, moving towards Florida.
 Figure 3 Airmass RGB imagery from GOES-16, valid beginning 2200 UTC 14 April 2021 (5pm local time). Warm, moist airmasses appear in the green coloration. Dry airmasses appear in the lighter orange coloration. Dry, highly stable air (advected from the stratosphere) appear in the dark orange/red coloration. Cold, dry (polar) airmasses appear in the dark blue/indigo coloration.
Finally, the information gathered from various satellite products can be verified by referring to radar imagery. Base reflectivity in Figure 4 shows the highest dBZ values located east of Houston. This corresponds to the areas of most intense precipitation. The regions with the highest dBZ values also raise concern for hail formation. By referring to other radar products (such as correlation coefficient imagery and differential reflectivity imagery, not shown here), hail does not appear to be forming with these storm cells. The cells show a clear core and gap structure as well, so there is concern for the formation of cold pools that may drive more local upward vertical motions.
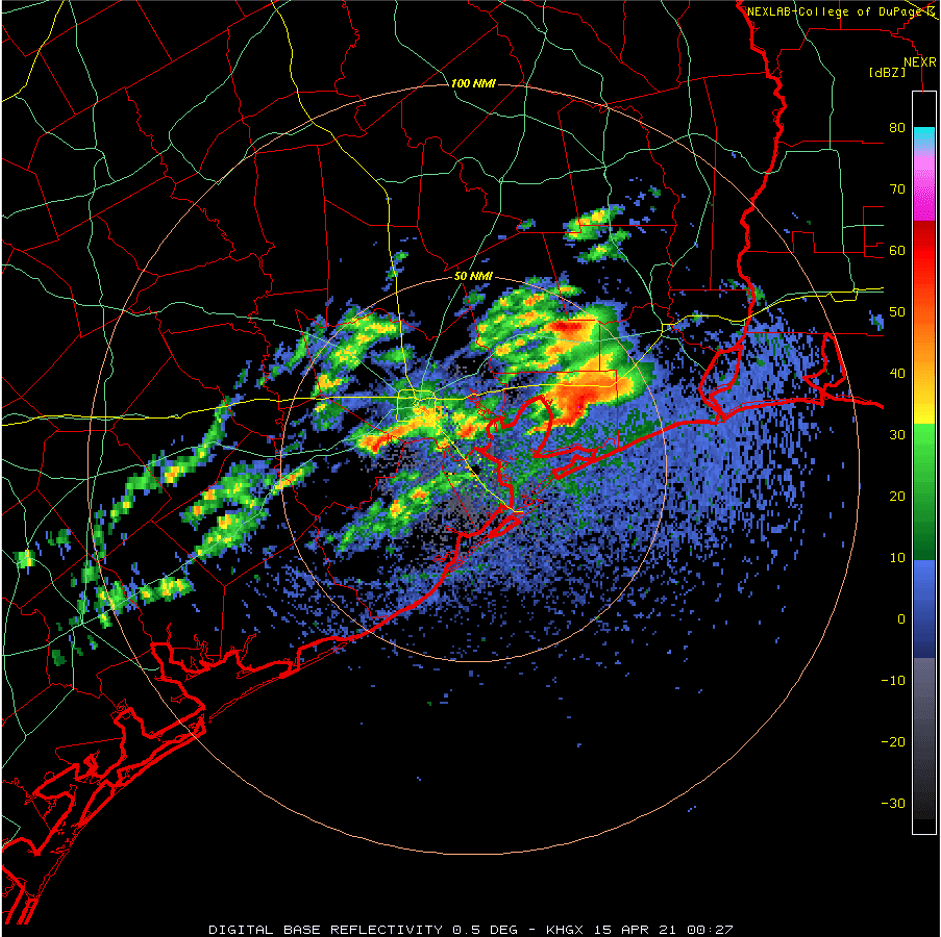 Figure 4 Base reflectivity from KHGX (Galveston, Texas), valid beginning at 0000 UTC 15 April 2021 (7pm local time). The highest reflectivity values (in dBZ) are shown in the red/orange colors. These correspond to the regions experiencing the heaviest rainfall.
Though these storm cells rapidly appeared over the South, there was little impact from their formation. They ended up bringing rain to eastern Texas and southern Louisiana in a classic diurnal heating set up. This event brought a taste of what’s to come in this region over the next few months of late spring and summer!