
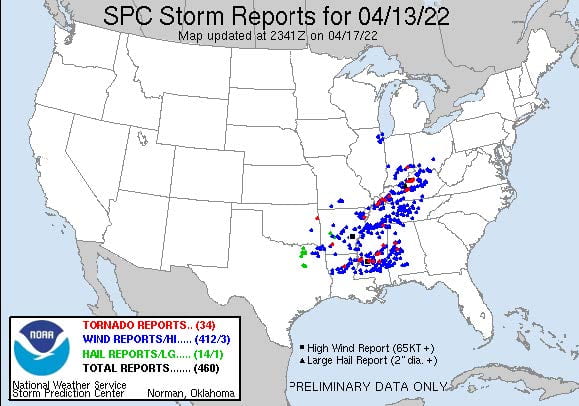
SPC Storm Report showing tornadoes, high wind and hail
On April 11th 2022, an intense low in the Northwest United States evolved over the next few days to produce blizzards in the north and an impressive squall line in the south. The 13th was perhaps the most eventful for the south as a total of 34 tornadoes were reported and in two states (Mississippi and Arkansas), there were winds recorded over 65kts.
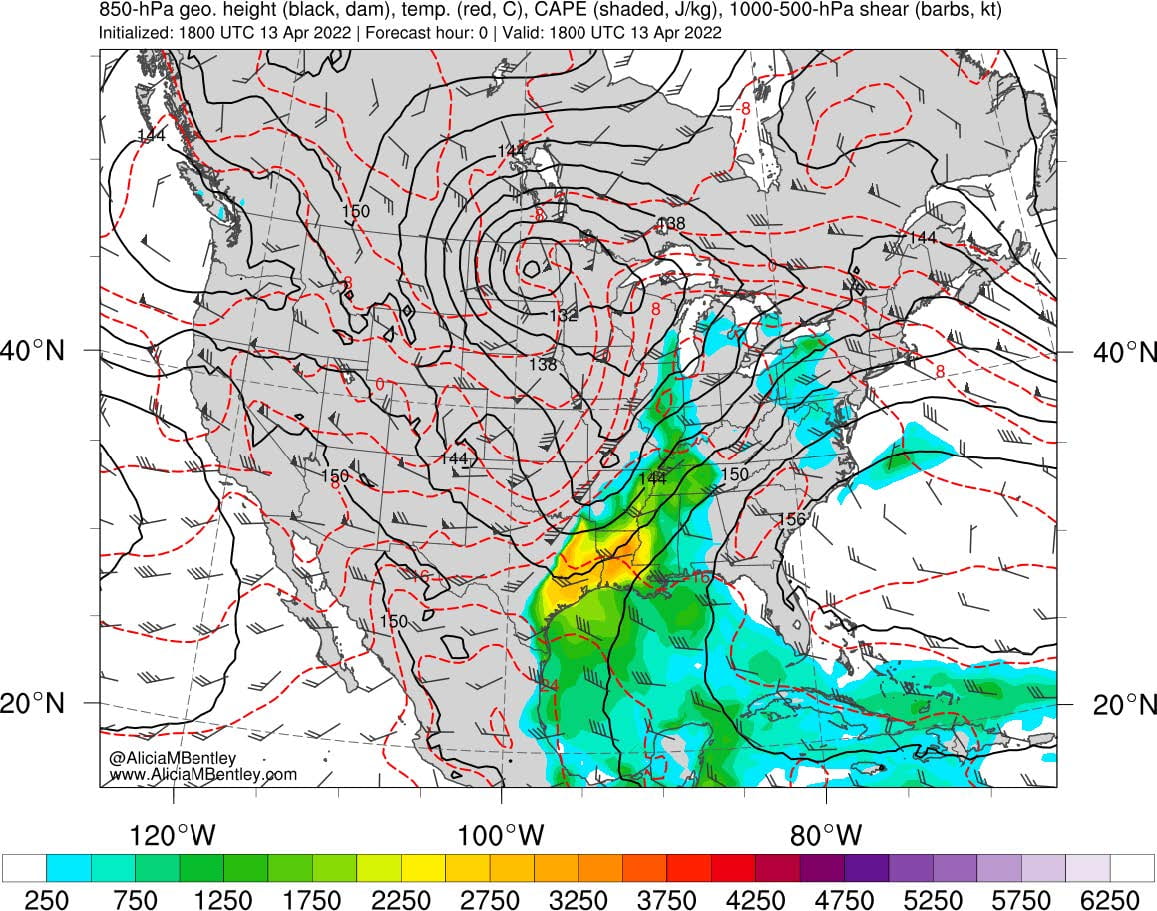
CAPE map hours before strongest tornado spawning in east Mississippi, initialized 18Z
As can be seen in the map of convective available potential energy (CAPE), this system had ample energy and instability in the atmosphere to take advantage of. CAPE values of 1000J/kg are enough to support severe weather but anything over 2500J/kg is very significant and there are certainly portions of Louisiana and Texas that cross this threshold according to the map. CAPE directly correlates with instability in the atmosphere which is a main drive for severe convective activity.

250mb map of thickness values and the upper level jet over the continental U.S.
This 250mb map depicts where the jet is located and is strongest. The jet diverges and forms a ‘v’ shape right at the western border of Louisiana. This directional divergence of the jet points directly to there being dynamic instability in that region. The jet also curves northward, wrapping around the bottom of the trough feature.

Perhaps the clearest depiction of the trough feature is on the 500mb vorticity map. The axis of maximum curvature runs from Mississippi up to North Dakota so there is a clear negative tilt. A negative tilt trough axis maximizes the advection of counterclockwise spin so this furthers the instability of the atmosphere over the south. The blue boxes mark where there is air rising and are clustered over Mississippi at 0Z on the 14th which is approximately 7pm on the night of the 13th. The strongest tornado to spawn in the state spun up at approximately 9pm.

Surface Analysis of the continental U.S. issued at 01:28Z APR 14 or 08:28CST APR 13
The surface low over North Dakota was at an impressive 991mb, getting as low at 989mb hours after this map was created. The system has a cold front spanning the width of the U.S. moving eastward with a clear squall line out front denoted by the red dots and dashes. The surface map shows a clear difference in moisture east of the front and west of the front. The difference between the dewpoints and temperature behind the front are substantial while the difference out front is minimal with some showing a completely saturated atmosphere (where dewpoint and temperature are equal). The
wind barbs are also showing that there is a southerly wind from the Gulf of Mexico providing warm moist air for the dryer air behind the front to interact with.

GOES Visible and Infrared Satellite loop depicting the evening of April 13th
This satellite loop shows clear signs of a strong upper level jet as well as strong updrafts from the squall line in the south. There is transverse banding over eastern Iowa indicating that the jet is in the same place as depicted in the 250mb jet map above. There are also overshooting cloud tops over Louisiana and western Mississippi where the squall line is progressing.

Base reflectivity imagery starting at 8:50CST of Squall Line
The radar loop above shows the main line of storms responsible for producing a majority of the 34 tornadoes that spawned that day. The strongest tornado touched down around 9pm just south of Meridian, MI.

Base Velocity Loop of Tornado South of Mississippi Around 9:00pm April 13
The base velocity loop above depicts a clear coupling indicating the location of winds wrapping around each other. The deep red and light gold are clearly wrapping around each other indicating that the winds are moving both eastward and westward, not just following the trajectory of the squall line. The tornado signature is difficult to see in a squall line on base reflectivity and is made much more apparent using base velocity images.