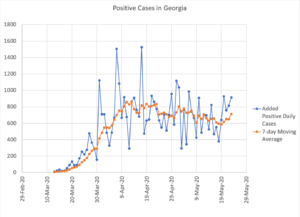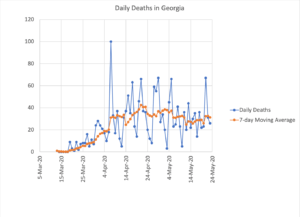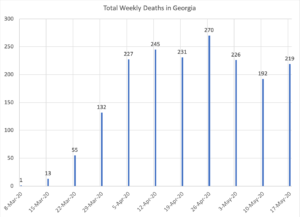
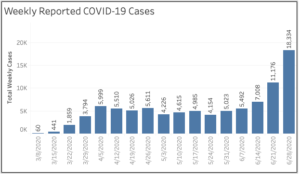
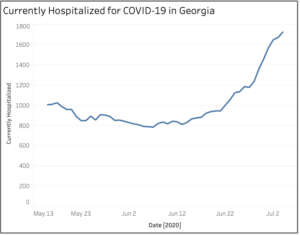

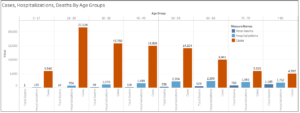


This past week, we see a lot of new detected cases in Georgia. Part of this increase could be due to younger people getting infected (20% of detected cases are 18-29 year olds), and part of it is due to more asymptomatic people getting tested; no reliable data I can find on percent of asymptomatic testing over time. – However, testing alone doesn’t explain the increase in cases, as we see 13% increase in testing but 59.4% increase in cases. – Deaths have trended down week over week. – It’s important to note that COVID-19 Hospitalizations have started to trend up after a period of a downward trend. But, the rate of hospitalizations (hospitalized/detected cases) have gone down to 14%, compared to 17% at the end of May.
Georgia COVID-19 Tracking Dashboard
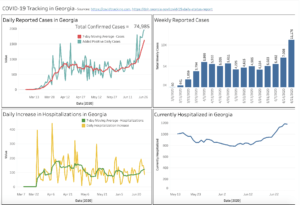
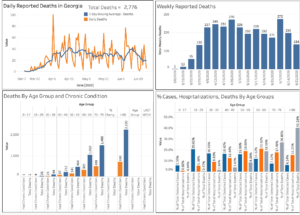
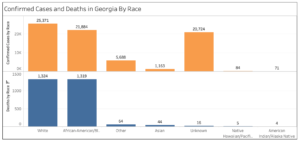
Several people have reached out asking for the charts that I have been updating weekly. I ended up creating a dashboard that pulls the data from GDPH daily.
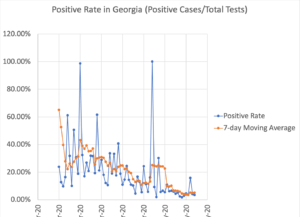
As of June 9th, cases in Georgia have gone up, but so has testing. The positive rate of cases in Georgia is above national level; has been hovering around 8%, while nationally it’s at 4%.
It’s going to be interesting to see if we see a consistent uptick in case rates in the weeks following the large gatherings of people protesting in various locations in Georgia, primarily in Atlanta.
COVID-19 Georgia Metrics Dashboard Link.
– The charts show that we have been in a plateau for all of May. We need to start seeing this trend downward faster. 7-day average daily death count has been around 29. Imagine this continues for two more months, that’s about 1,700 more deaths.
– One thing to note if you are noticing a difference in the trends when compared to the Georgia Department of Public Health charts. I am plotting the data when reported. GDPH plots data points based on occurrence date, which is a problem when there is a long lag between “occurrence” and “reporting”. Their charts would be more accurate in the long run.

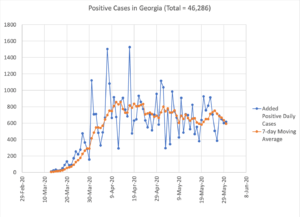


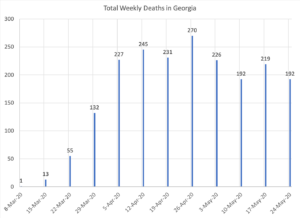
Updated the charts based on the last severn days of data. Still at a plateau in Georgia although an argument can be made that there is a slight uptick. It will be interesting to see what happens a week to 10 days after Memorial Day weekend. Source of Data: https://covidtracking.com
