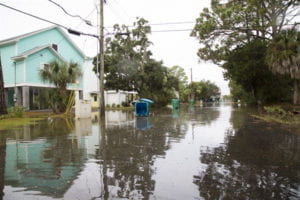
Coastal Georgia is already facing the effects of climate change induced sea level rise. Since 1935 the sea level at Tybee Island has risen over 10 inches triggering widespread and frequent flooding.
Future sea level rise is caused both by expansion of warming water and the flow of additional water from melting glaciers. However predicting future global and local sea level rise is complicated by multiple uncertainties.
For the Fourth National Climate Assessment the Federal Interagency Sea Level Rise and Coastal Flood Hazard Scenarios and Tools Task Force, produced a set of probabilistic coastal sea level rise scenarios for the entire nation. They are conditioned on different levels of global mean sea level rise (GMSL) from 0.3 meters to 2.5 meters. The following table links the different global mean sea level (GMSL) scenarios to three of the Representative Concentration Pathways to show the probability of reaching each GMSL level under each pathway.
| GMSL Rise Scenario (for year 2100) | RCP2.6 | RCP4.5 | RCP8.5 |
|---|---|---|---|
| Low (0.3m) | 94% | 98% | 100% |
| Intermediate-Low (0.5m) | 49% | 73% | 96% |
| Intermediate (1m) | 2% | 3% | 17% |
| Intermediate-High (1.5m) | 0.4% | 0.5% | 1.3% |
| High (2m) | 0.1% | 0.1% | 0.3% |
| Extreme (2.5m) | 0.05% | 0.05% | 0.1% |
For example, under RCP 8.5 there is a 17% chance of exceeding the intermediate level of 1 meter, making this a reasonable planning target, assuming business-as-usual.
The following maps show southeastern U.S. projected sea level rise for 2050, 2100, 2150, and 2200 under the GMSL 1.0 meter scenario. The colored circles show the centroids of the grid used to model sea level rise colored by the number of inches of projected sea level rise. The purple-colored flooded sections show areas in which projected sea level rise exceeds current elevation from as a U.S. Geological Survey digital elevation model. Projected sea level for each location was calculated through spatial interpolation model using an inverse distance weighting algorithm applied to the grid cell centroids for the set of points shown on the map.
The full national dataset grid dataset has been converted to a shapefile and is available for download here.

