One of the many exciting recent products to come out of the development and implementation of the GOES-16 satellite is that of RGB imagery, where multiple channels are used and colored using the red, green and blue (RGB) color spectra to identify a variety of meteorological features of interest. One of the products, available at the University of Wisconsin – Madison’s Department of Atmospheric and Oceanic Sciences “weather” webpage, is the “Day Cloud Phase distinction RGB” imagery. We will have more posts in the future focusing on applications of such imagery, but for this post we will focus on the basics.
An example image is shown below (link: https://whirlwind.aos.wisc.edu/~wxp/goes16/multi_day_cloud_phase_rgb/conus/latest_conus_1.jpg).
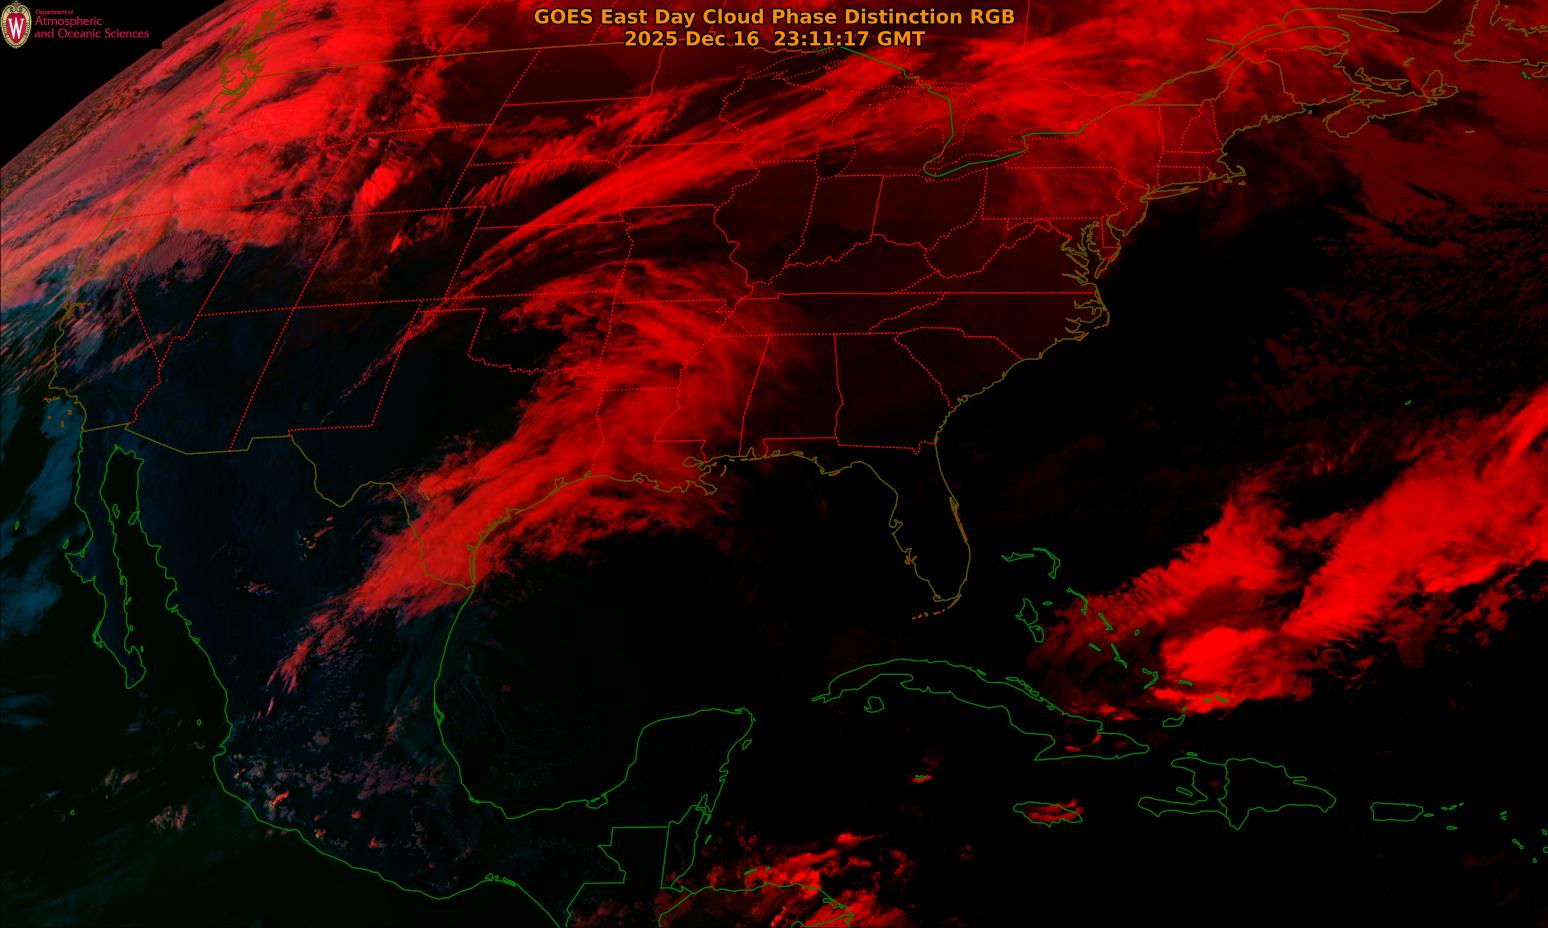
The use of the RGB color scheme aids in the identification of other subtle features as well; the table below summarizes some applications of this product (see link for more details about how to use this product: http://rammb.cira.colostate.edu/training/visit/quick_guides/Day_Cloud_Phase_Distinction.pdf). The red color corresponds to an IR band, and this represents emitted radiation from surfaces and cloud tops towards the satellite. The green and blue bands are within the visible spectrum, and this represents radiation reflected off of surfaces back to the satellite.

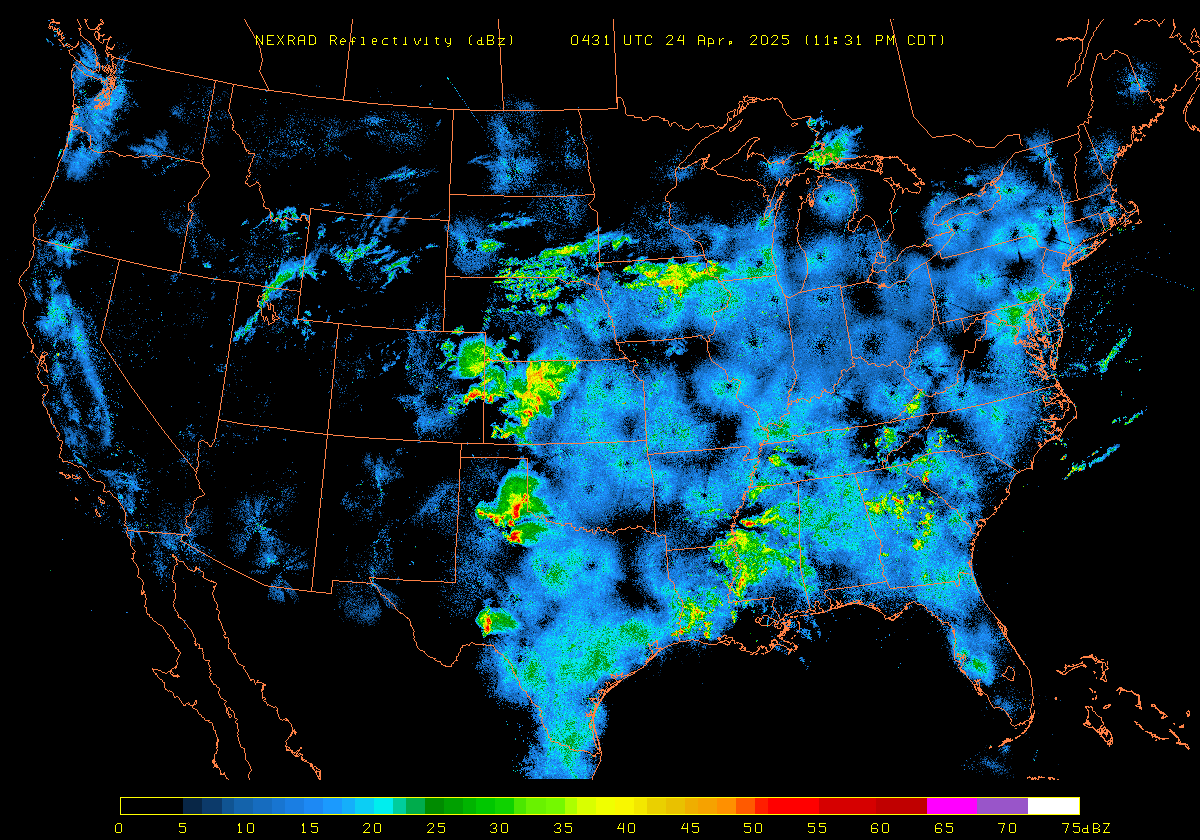
With respect to the cloud tops in the image above, the deepest cloud structures (those associated with the strongest vertical motions) are red in color, representing cold cloud tops. These cloud tops are comprised of ice particles; some examples include the remnant MCS over eastern Iowa, northern Illinois and southern Wisconsin (see radar reflectivity below; source: http://tempest.aos.wisc.edu/radar/us3comp.gif) as well as the tropical convection west of Mexico. The green colors over cloud tops in the image above reflect (no pun intended) cloud tops primarily of lower cloud structures associated with moderate precipitation. This can be seen in association with some of the convective activity over southern Louisiana. The blue colors represent radiation reflected off of land and clouds very low in the troposphere (those made up primarily of liquid water particles); note how blue the land looks over the contiguous U.S.