On January 29th Boston, MA saw nearly two feet of snow in a day, nearly breaking an all-time daily record of 23.6”. This storm is not unusual, however, as it took the shape of the classical nor’easter. A nor’easter is a strong storm system that sweeps up the coast of the eastern U.S, typically resulting in a severe or winter storm threat. These storms gather energy by pulling in moisture from the relatively warm waters of the western Atlantic, driving it in an anticlockwise direction. With the combination of moving up the coast and this circulation, nor’easters can create dangerous or life-threatening situations for people along the northeastern U.S. coastline. One interesting aspect of this storm was the negatively tilted trough, or elongated regions of low pressure, seen hovering over North Carolina and Virginia on the morning of the 29th:

Figure 1. 500 Millibar Analysis Map of the Contiguous U.S. at 7 a.m. EST on Jan. 29th.
This trough assists in the main storm system further to the east by allowing for stronger convergence at the surface low. This is because to the east of troughs there is stronger divergence in the upper level, allowing for more air to converge at the surface, strengthening the storm. Additionally, this trough was negatively tilted, which means the trough axis was along a northwest to southeast line. This indicates the storm was strengthening or was near maturity at this point, as the excess movement in the trough at this stage may cause it to dissipate as it becomes more tilted. Moving down through the atmosphere to the surface, the map below shows a combination of satellite infrared imagery with a surface analysis map:

Figure 2. Surface analysis and infrared satellite view of the nor’easter early on the 29th.
The surface low can clearly be seen off the coast of North Carolina in this map. The color scheme indicates the temperature of the object, as seen from a satellite; the redder the object, the cooler it is. This temperature can be useful for determining the strength of some storm systems, and here it is evident that the nor’easter is involved with the large region of cooler clouds. The large swath of clouds and cool cloud tops over New England indicates unsettled weather in these regions. Moving to the southeast, the cold front passing over Georgia and Alabama brought along with it some backside moisture, creating light to moderate snow showers as seen in the radar loop below:

Figure 3. Radar loop of light and moderate snow over the south around midnight on the 29th.
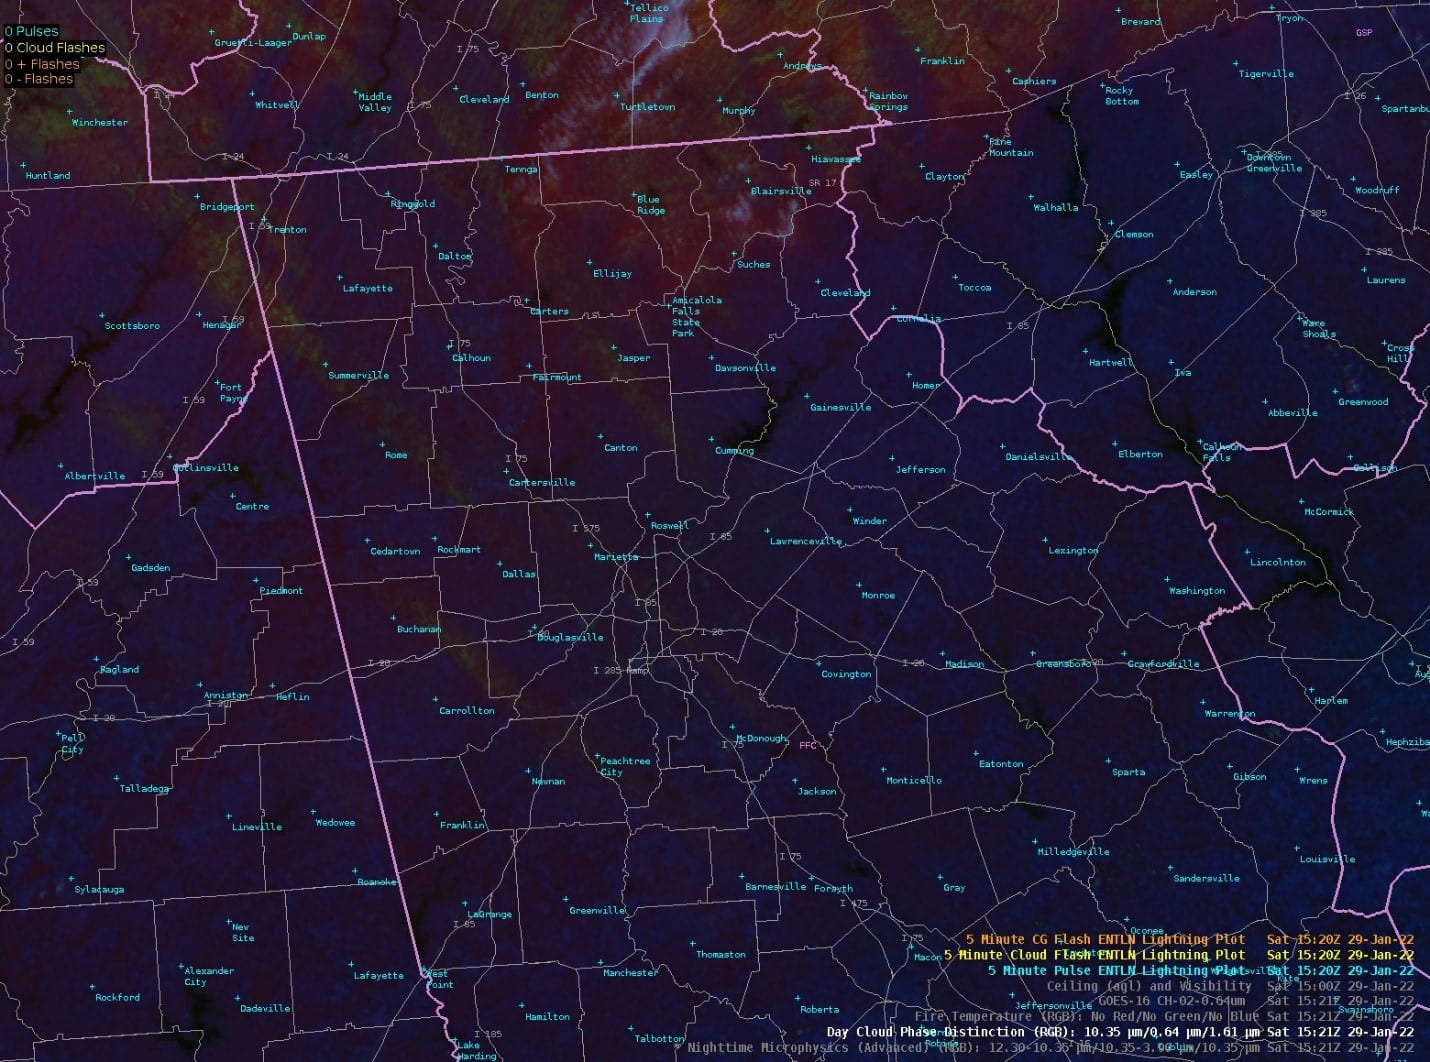
Here, the path of the snow is northwest to southeast, identical to the direction of the cold front. These quick 15–30-minute snow showers brough totals of almost one inch in some places, resembling snow squalls typically seen farther north. This isn’t too surprising considering the modest radar reflectivity seen above, which corresponds to precipitation intensity. Additionally, the snow totals were enough to see using satellite imagery. For example, the specialized red, green, and blue (RGB) imagery called the “day cloud phase” from GOES-16 can pick up the small amount of snow cover. Overall, this event brought wintry weather to much of the eastern U.S., with a surprise snowfall closer to home in the southeast.

Figure 4. Snowfall seen in this RGB satellite product is represented as green streaks over northern Georgia and Alabama.

