The official hurricane season for the Atlantic starts on June 1, but tropical storm Arthur decided to challenge that. As an upper-level disturbance from the Gulf of Mexico makes its way towards a stalled front in the Florida straits, the East Coast is about to get an early start to a record-breaking hurricane season.

Surface Analysis of the continental U.S. was issued at 1000z on Sunday, May 10, 2020. A stationary front over the Florida Straits that kickstarted the storm.
In the image above, there is a stationary front stalled over the Florida Straits around May 10th, which caused showers and thunderstorms over the next few days. “On 14 May, an upper-level trough moved into the central Gulf of Mexico and began to interact with the front, increasing the coverage of convection over the Florida Straits,” said Andy Latto of the National Hurricane Center.

Weather.us Historical Doppler Radar Imagery MAY 18th 1:33 am EST. A small corner of the developing storm is just visible off the coast of Florida.
Because the storm never veered closer than 20 miles to the coast, satellite imagery played a crucial role in identifying and predicting this storm. NOAA’s GEOS-16 satellite provided crucial measurements of the upper-level atmospheric conditions during the formation of Arthur. The limitations of the Doppler radar’s distance in the image above can be seen; this is the most visible storm on the radars of Florida. However, in the satellite imagery below on May 17th, it can be observed that the Doppler radar only provides a glimpse into what is happening offshore. A storm is seen brewing inside the Gulf Stream.

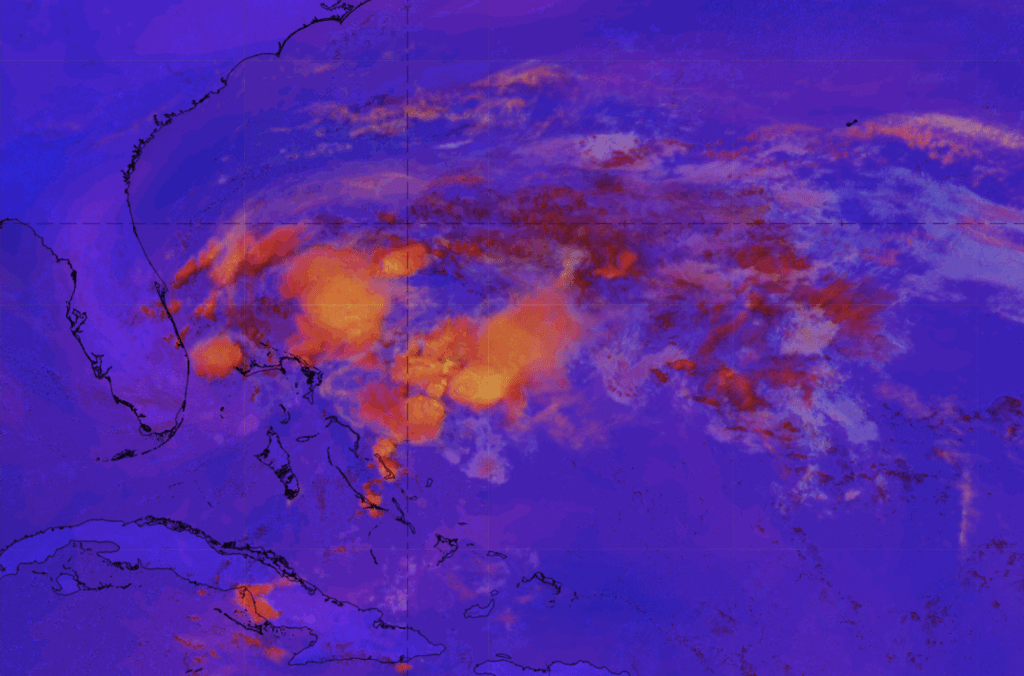
GOES-16 “Clean” Infrared Window (10.35 µm) loop May 17th, 2020 starting at 10:00Z. The developing storm is just outside of Florida in the Gulfstream.
At the beginning of this infrared window, the red indicates very cold cloud tops, suggesting vigorous updrafts and strong convection. However, towards the end, some of these cold cloud tops disappear, as indicated by the green and blue colors. The reason for this, as explained by Latto of the NHC, is that “Arthur’s north-northeastward motion offshore of Georgia and South Carolina briefly took it away from the Gulf Stream, resulting in little change in intensity through May 17.” Eventually, the Gulf Stream quickly regained control of the storm, and Arthur became extratropical, reaching peak intensity (50 kt winds/990mb pressure) off the coast of North Carolina at 06:00 UTC on May 19. “The heaviest rain fell across the southern coast, where as much as 3″ to 5″ of rain occurred. Heavy rain spread northeast, with 1″ to 3″ falling from near Swanquarter and Columbia, eastward across the Outer Banks,” said the National Weather Service.

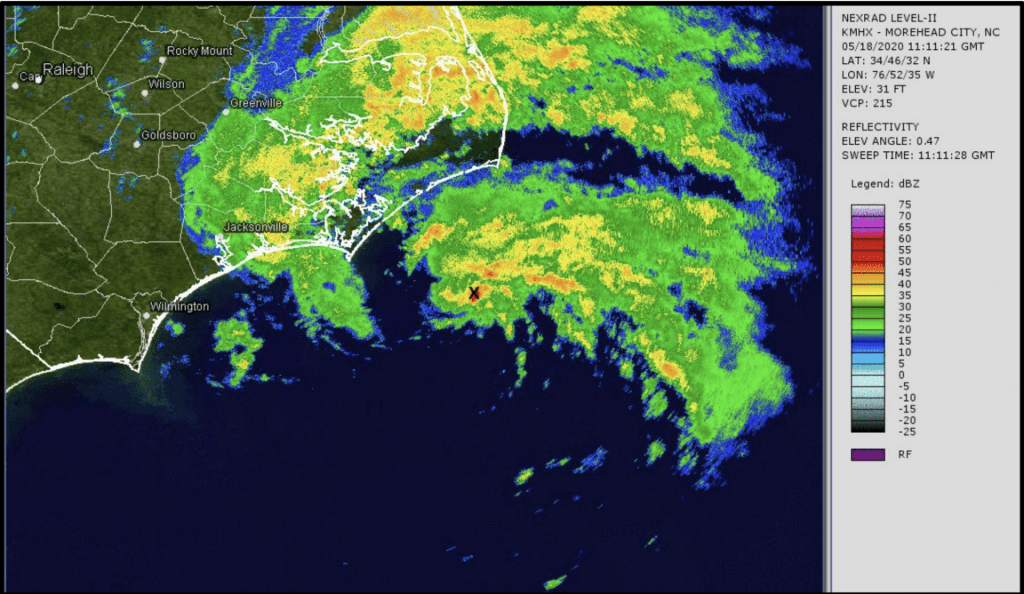
Weather.us Historical Doppler Radar Imagery May 19, 10:03 am EST. Arthur made its closest approach toward North Carolina. dBZ levels ranging from 5-50 indicate moderate rainfall.
On May 19th, Arthur attained its peak intensity, reaching 50 knots and officially classifying as a tropical cyclone. The closest proximity of Arthur to land is evident in the Havelock Doppler radar imagery. Notably, Cape Hatteras and the lower Virginia areas faced storm surges along with substantial rainfall. In the radar image, shades of blue and green correspond to lower dBZ levels ranging from 5 to 35, indicating light to moderate precipitation, while yellow and red signify higher dBZ levels ranging from 35 to 50, representing heavy precipitation.
NWS SPC maps:
https://www.spc.noaa.gov/exper/archive/event.php?date=20200517
Weather.us historical radar
https://weather.us/radar-us/north-carolina/reflectivity/KMHX_20200518-063322z.html
NWS statement
https://www.weather.gov/mhx/tropicalstormarthur
NHC National Weather Outlook
https://www.nhc.noaa.gov/archive/xgtwo_5day/gtwo_archive_list.php?basin=atl
NHC Tropical Cyclone Report
https://www.nhc.noaa.gov/data/tcr/AL012020_Arthur.pdf