Heavy rainfall hit the southeast United States on Friday, March 1, 2024, continuing throughout the entire day as it moved east. In Atlanta, the ongoing downpour occurred starting in the morning and continued for many hours into the night. On March 2, 2024, most of the rain had passed, but dense fog and scattered showers appeared throughout the morning. Figure 1 is the NEXRAD MOSAIC Radar Reflectivity, taken in the southeast US on 01 March 2024 at 15:55 UTC (10:55 am). This type of radar is commonly used by meteorologists and weather enthusiasts alike, as it is a helpful way to see where precipitation is occurring and the intensity of the precipitation. The warmer colors represent more intense precipitation, whereas the cooler colors represent less intense precipitation. At this time, lots of heavy rain can be seen across the northern half of Georgia and a majority of Alamaba, signified by the yellow and orange colors. By 4 am EST, the radar showed nearly all the rain having passed Georgia.

Figure 1. NEXRAD MOSAIC Radar Reflectivity valid 01 March 2024 15:55 UTC (10:55 am EST). The color scale is on the right-hand side. The warmer colors represent more intense precipitation, whereas the cooler colors represent less intense precipitation. Credit: https://www2.mmm.ucar.edu/imagearchive/
One of the reasons for this heavy rain system was due to the significant moisture in the atmosphere supplied by the Gulf. As air comes from the Gulf, it is typically warmer and more moist air, so as it continues to move northeast, the moisture in the atmosphere comes down as rain. The heavy moisture that fueled this rain system can be seen in Figure 2. This satellite imagery is taken from the GOES-18 mid-level tropospheric water vapor satellite, showing areas of mid-level atmosphere moisture/water vapor content. The blue colors represent moist air, whereas the orange and red colors represent dry air. The areas of extremely moist air extend from the gulf all the way up to Virginia and Ohio and follow the same pattern as where there was intense rain.

Figure 2. GOES-18 Mid-Level Tropospheric Water Vapor Satellite Imagery valid for 01 March 2024 18:00 UTC (1 pm EST). The warmer colors are associated with dry air, and the white and cooler colors are associated with moist air where water vapor is present. Credit: Colorado State Univeristy CIRA RAMMB Slider.
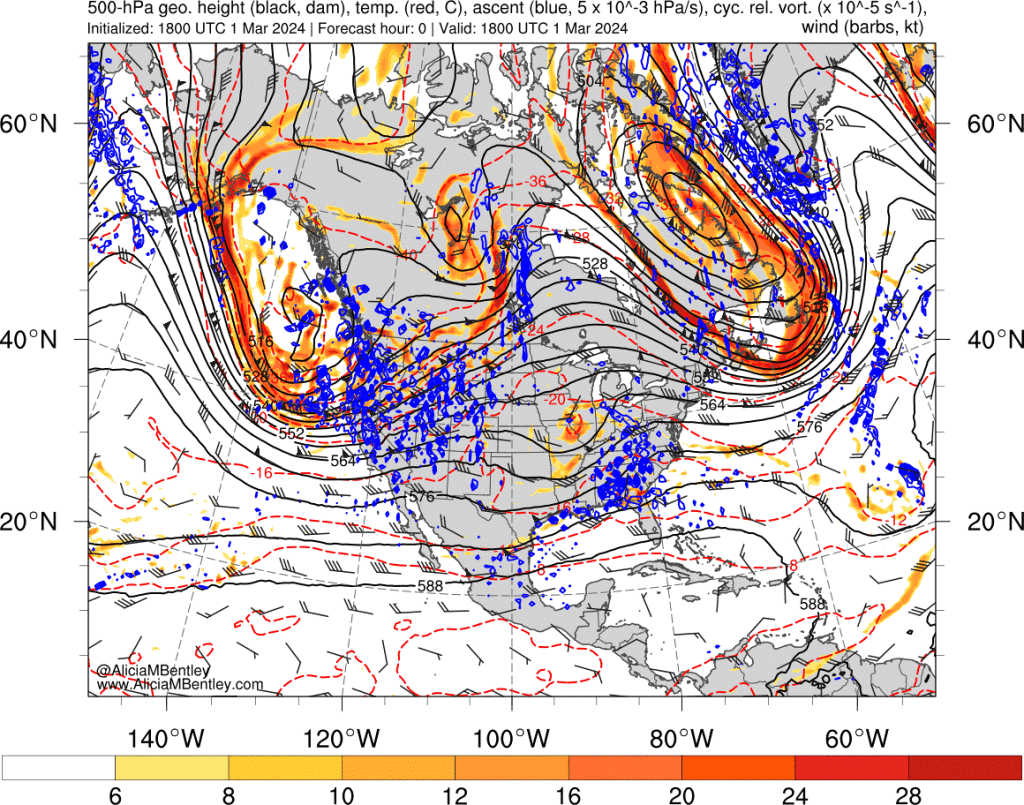
Another reason for the rain was due to the upper-level dynamics in the atmosphere. Figure 3 was taken 01 March 2024 18:00 UTC (1 pm EST), and shows troughs and ridges in the higher level atmosphere, as well as cyclonic relative vorticity in the orange/red shading, and upward vertical motion in the blue. At this point, there is a shortwave trough over Missouri, with our location of interest being just east of the trough. East of troughs is often where upward vertical motion occurs. Over Georgia, there was lots of upward vertical motion, which is also where lots of precipitation occurred. Upward vertical motion helps in the creation of clouds, so in combination with the high water vapor content in the atmosphere over the southeast, it was the perfect recipe for precipitation.

Figure 3. 500 mb Geopotential height in the black contours. Dashed red lines show temperature in degrees Celsius. Blue markings represent upward vertical motion. Red and orange shading represents cyclonic relative vorticity. Wind barbs are measured in knots. Valid 01 March 2024 18:00 UTC (1 pm EST). Credit: Alicia M. Bentley.

