On the evening of March 24, 2023, a severe weather event impacted the southeastern United States, with the strongest storms and tornadoes occurring in Mississippi. A low pressure system centered over Missouri and Arkansas brought warm, moist air into the Deep South from the Gulf of Mexico while a large trough in the upper atmosphere brought high wind speeds over the area. The combination of these features led to an environment prime for severe storms and tornadoes, including a deadly EF4 in central Mississippi.

Figure 1. Surface map on March 25, 2023 00:00 UTC. (Source: WPO Surface Analysis)
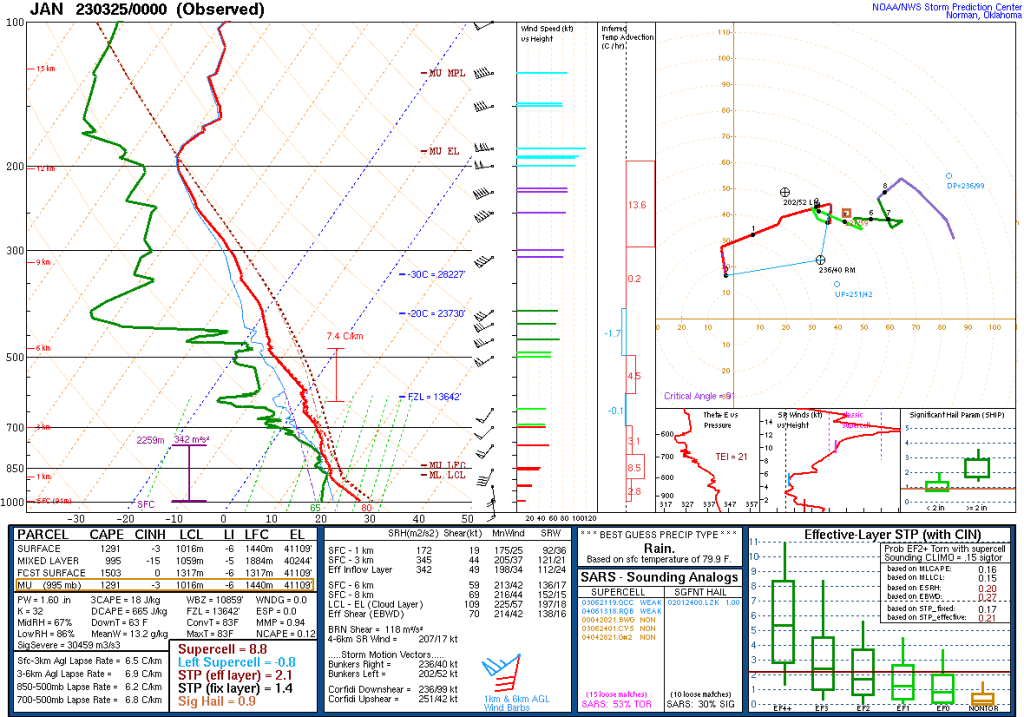
As can be seen in Figure 2 below, a line of storms was ongoing in Arkansas, Texas, and Louisiana at 18:55 UTC, or around 1:55 PM local time. This line would not be the main cause of the damaging tornadoes. Instead, the individual, the discrete storm cells that began to form in front of the line in southern Louisiana and Mississippi would be the strongest storms of the night. As shown in Figure 3 below, these storms were in an environment that was very favorable for tornado formation. Wind shear, or the change in wind direction with height, was favorable for tornadoes, with winds coming from the south at the surface between 5 to 10 knots shifting to 60 knots and from the west by the 500 mb level. This shear allowed any updrafts that formed to easily rotate. Furthermore, the CAPE values, or the energy available for air to rise, was around 1300 J/kg at Jackson, Mississippi, and was likely higher where the strongest tornadoes occurred. These values are favorable for the formation of strong thunderstorms. Combined with the strong wind shear, any storm that formed in this environment would have the chance to spawn a strong tornado.

Figure 2. Radar Loop of the event from March 24, 2023, 18:55 UTC to March 25, 2023, 6:55 UTC. (Source: UCAR Radar Archive)

Figure 3. Jackson, Mississippi 00:00 UTC March 25, 2023 sounding. (Source: NWS Jackson)
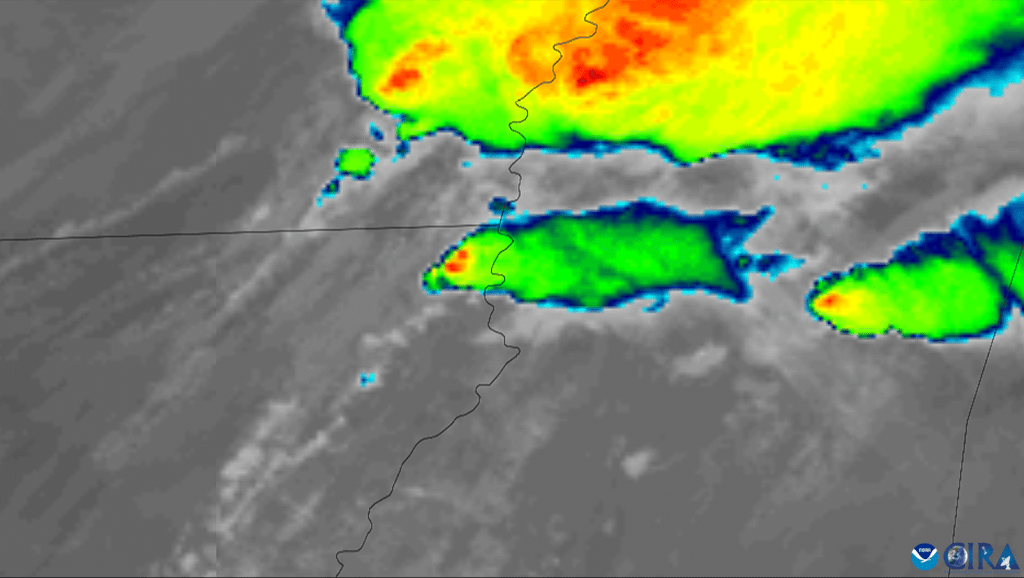
One storm was able to take full advantage of this environment and produced a very large and strong EF4 tornado that impacted the town of Rolling Fork, Mississippi. This cell formed in Louisiana and strengthened quickly, especially after it crossed the border into Mississippi. The rapid growth of this storm can be seen in the infrared satellite loop in Figure 4. The areas of green indicate the areas where cold cloud tops are, while the areas of yellow and red indicate the coldest cloud tops and thus the strongest convection. As the storm approached the town of Rolling Fork, it began to develop a strong area of rotation and began producing a strong tornado. A radar reflectivity scan of the storm as it passed through Rolling Fork can be seen in Figure 5.

Figure 4. IR satellite loop of the event from March 24, 2023, 23:10 UTC to March 25, 2023, 01:30 UTC. (Source: RAMMB-CIRA Satellite Library)

Figure 5. Velocity and reflectivity radar scans of the Rolling Fork storm at March 24, 2023, 8:07 PM local time. (Source: Weather.us)
This radar reflectivity image provides a good example of why radar reflectivity alone is not sufficient for viewing tornadoes. While the tornado’s location can be inferred, it does not have an extremely clear hook echo characteristic of most tornadoes and thus can be difficult to spot using reflectivity alone. However, when looking at the velocity product in Figure 5, the area of strong rotation becomes very clear. The areas of green and blue indicate where wind direction is moving towards the radar, while the areas of red and brown indicate where the wind direction is moving away from the radar. A very strong velocity couplet can be seen directly over the town of Rolling Fork. This is defined by the very strong area of winds moving in opposing directions. Wind values of at least 60-70 mph moving both towards and from the radar can be observed on this scan in very close proximity to each other. This area is very well defined and indicates that a strong tornado is very likely ongoing. Furthermore, the strength of the tornado can be seen through the debris that it lofted into the atmosphere. Figure 6 shows a vertical scan of the storm and displays the correlation coefficient. This parameter measures uniformity of the objects being scanned by the radar. While rain will have a high correlation coefficient, irregular objects such as debris will have a low correlation coefficient and thus their location can be seen on radar. The areas of blue and green represent the areas of low correlation coefficient and therefore the areas of debris. As seen in the figure, debris was lifted to an altitude of nearly 25,000 feet. Much of this debris was likely from trees and any structures or towns that were hit. Ultimately, the damage this tornado caused was rated as EF4 damage with estimated wind speeds of up to 195 mph. 17 people lost their lives due to this tornado.

Figure 6. Vertical correlation coefficient of the Rolling Fork storm. (Source: NOAA)

