
The focus on April 8th, 2021 in the meteorological realm was an extratropical cyclone over the Midwest. There were four satellite images that were observed in class. These will be broken into two figures so the images will be larger and still comparable. The mid-level water vapor channel on GOES-16 shows dry air wrapping around and into the cyclone in a comma shape from North Dakota south and east all the way to Alabama and back north and west into Missouri at the center. The darker shades are dry air, and the whiter shades are moist air and higher cloud tops if they are very bright. Similarly, the airmass RGB has an orange rust color stand in for dry air where green air is moister. White is clouds, with brighter whites being higher cloud tops. The dry air intrusion at mid-level helped strengthen the cyclone by enhancing sinking of cold air and maintaining the updraft of warm air.
 Fig. 1: (top panel) A mid-level water vapor satellite image where dark shades are dry air and light shades are moist air (source: https://whirlwind.aos.wisc.edu/~wxp/goes16/wv/goes16_namer.html) from 08 April 2021 at 1350 UTC, and (lower panel) is an airmass RGB satellite image from 08 April 2021 at 1400 UTC where rust is dry air, green is moist air, blue is colder air, and purple at the corners is limb effects (not accurate data). (source: https://weather.cod.edu/satrad/?parms=continental-conus-airmass-24-0-100-1&checked=map&colorbar=undefined)
The day cloud phase RGB at the top of Figure 2 is not useful at night (all the clouds turn red) but is useful for differentiating between types of clouds and snow during the day. The center of this cyclone is teal, meaning it has liquid water-based clouds. The northwest sector of the cyclone (the Dakotas and all of Minnesota) as well as the southeast sector of the cyclone (parts of Alabama, Georgia, and Florida) all have orange and yellow shades, which indicate higher cloud tops and convection. The bottom of Figure 2 shows the simple water vapor channel, where black represents dry air and light to white blues indicate intense convection and precipitation. Looking at Figure 2, as well as both the water vapor and airmass RGB channels, the heaviest precipitation looked to be over the panhandle of Florida. Figure 3 was radar reflectivity at the time, and it confirmed what the satellites displayed. Moisture being advected from the Gulf of Mexico likely helped the southern edge of the cyclone be more intense.
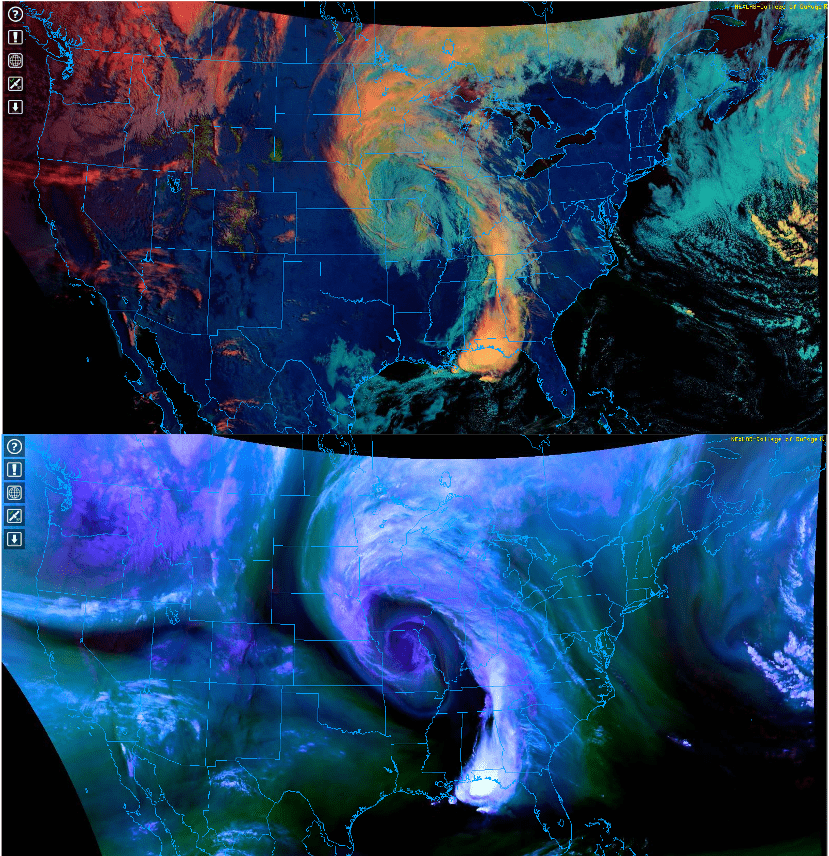 Fig 2: (top panel) A day cloud phase satellite image where teal clouds are liquid water drops, yellow and orange clouds are higher cloud tops, and red clouds are still under the terminator (source: https://weather.cod.edu/satrad/?parms=continental-conus-dcphase-24-0-100-1&checked=map&colorbar=undefined), and (lower panel) is a simple water vapor satellite image with black being dry air and bright blue whites being higher cloud tops with indication of convection. (source: https://weather.cod.edu/satrad/?parms=continental-conus-simplewv-24-0-100-1&checked=map&colorbar=undefined) Both are from 08 April 2021 at 1400 UTC.
 Figure 3: A radar reflectivity image in dBZ from 08 April 2021 at 1400 UTC. The strongest precipitation is over the Florida panhandle as indicated on the side color bar. (source: https://weather.cod.edu/satrad/?parms=continental-conus-comp_radar-24-0-100-1&checked=map&colorbar=undefined)
Finally, looking ahead to 0000 UTC on 2021 April 09, there is a small risk for tornadoes as the rest of the southern part of the system makes its way across the Southeast. The sounding from Tallahassee (KTLH) on the left of Figure 4 shows an opportunity for a process known as forcing. Forcing is when an air parcel, if moved higher up into the atmosphere, remains cooler than its environment but keeps rising if something forces it upward into the atmosphere. The right part of Figure 4 shows convective available potential energy (CAPE) values high enough for tornadoes to form. This is coupled with directional and speed wind shear, which is when the wind changes direction and speed as it moves upward into the atmosphere, which could induce rotation. The Storm Prediction Center put out a 2% risk for tornadoes over parts of the Southeast today for this reason.
 Figure 4: (left panel) A sounding taken on 08 April 2021 at 1200 UTC. The brown dotted line is the path an air parcel would take, the red line is the environmental temperature, and the green line is dew point temperature. Because the brown line is to the left of the red line, an air parcel would be cooler than the environment were it to rise, creating a situation where the parcel would have to be forced upward by a mechanism if it were to move because cool air tends to sink. (source: https://www.spc.noaa.gov/exper/soundings/21040812_OBS/). (right panel) A map showing convective available potential energy (CAPE) in J/kg (fill pattern) wind speed and direction at 10 m, 850 mb, and 500 mb, (white, green, and yellow, respectively) in kts.