Trough and Cold Frontal Precip in the SE US (author: Brad Rubin)

An active day was in store for parts of the Southeast US on Thursday, February 18th. A digging trough brought very frigid air south that not only kept a lot of country that was still dealing with the aftermath of a devasting winter storm earlier that week iced over, but also helped to set up a strong temperature gradient as warm, moist air advected into Florida and Southern Georgia. Airmass RGB is a type of enhanced

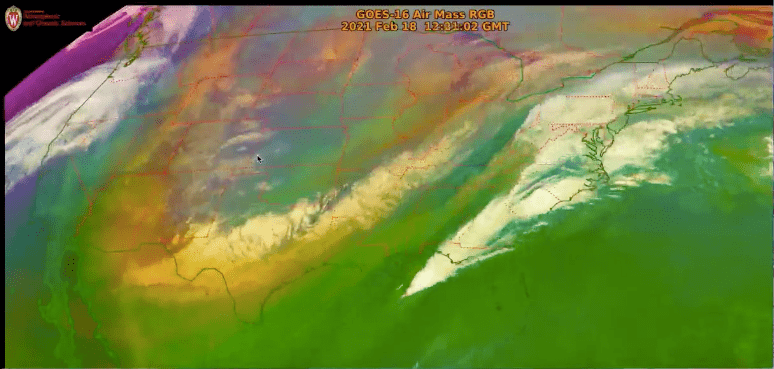
satellite imagery that helps to identify different kinds of air masses based on temperature and moisture. Greens indicate warm, moist air while blues indicate cold, dry air. The U-shaped area of orange and red indicates upper tropospheric dry air which can help to identify troughs and the jet stream. Cleary based on this image there is a boundary being set up with warmer and more moist air in the southeast with colder and drier air behind it in the central and southern plains. A surface analysis at 12z helps to confirm the established air masses and where the frontal boundary is positioned. Florida

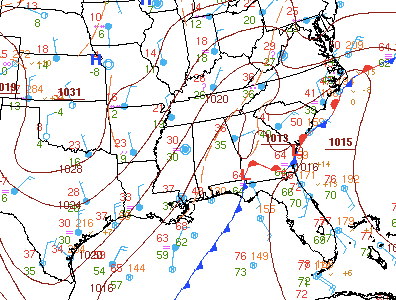
And parts of Southern Georgia are in the warm, moist air mass and are therefore in in the warm sector of the frontal boundary (bounded by the warm front to the north and the cold front to the west) with temperatures and dewpoints in the 70’s while further west you can see that these numbers plummet into the 20’s and teens.

Airmass RGB was able to give a hint at where the location of the trough might be, but in order to see this more clearly here is a picture of water vapor imagery over the same area. Water vapor imagery shows you the brightness temperatures of surfaces and cloud tops, but at a specific wavelength that targets water vapor. This

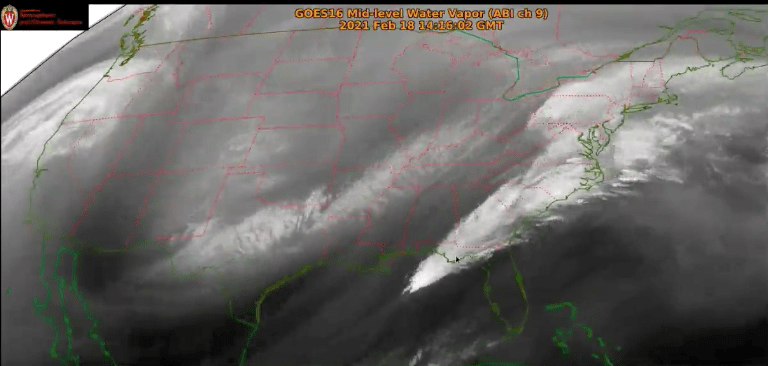
allows you to clearly see where moist air (brighter) and dry air (darker) is. This helps to further identify where a trough feature might be due to the dry upper-level air being brought down to the lower latitudes and there appears to be a similar U-shaped region as was seen with the Airmass RGB imagery. Clearly the southeast is under the influence of a warmer, moist airmass due to the very bright white colors shown over the area. A 300mb analysis map from the Storm Prediction Center at 12z confirms the location of the trough in the same general area as what was being shown on satellite.

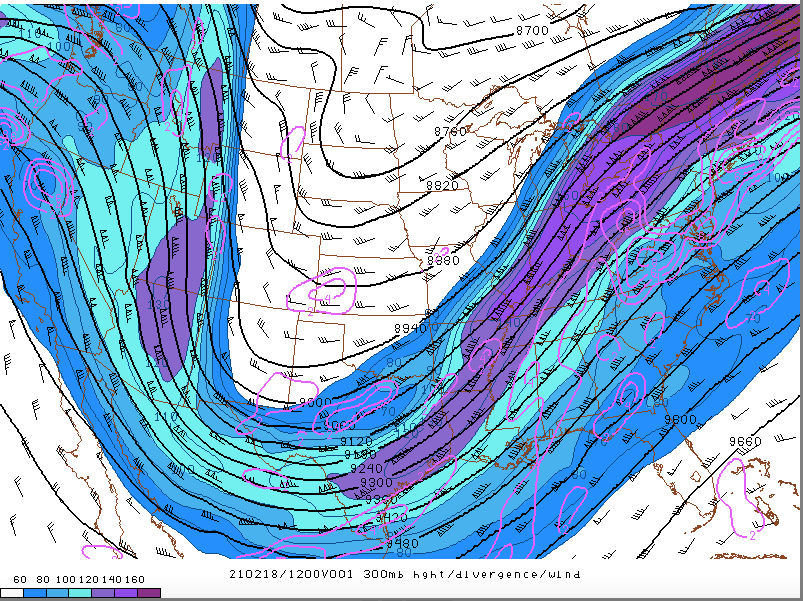
The position of the trough will play a big role in developing convection in the southeast during the day. Strong upper-level wind associated with the trough are shown with the fill pattern with 80-100kt winds over Florida and Georgia.

Now that the warm/cold airmasses and the location of the trough have been confirmed, let’s see where any precipitation is occurring. This is IR imagery which

shows brightness temperatures of surfaces and cloud tops, like with water vapor, except that these measurements are based on outgoing longwave radiation emitted from these surfaces which means that the brighter the feature, the colder the surface and the darker the feature the warmer the surface. This is helpful with identifying convection because bright objects indicate high (cold) cloud tops which is a sign of developing convection. There appears to be a SW-NE line of convection stretching from the Gulf of Mexico up towards the Mid-Atlantic and Northeast which is likely associated with the cold front shown on the 12z surface analysis shown earlier. NEXRAD radar reflectivity

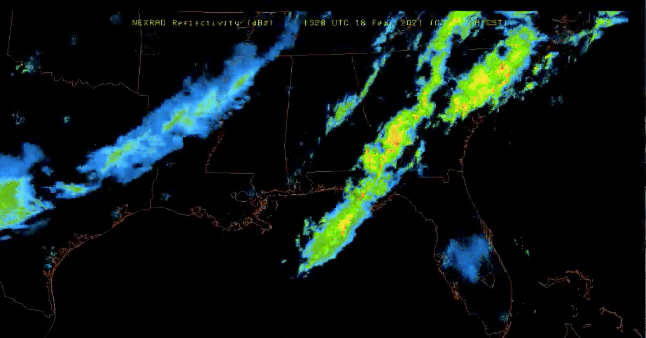
From ~13z that morning confirms the presence of convection across the southeast. A more cellular and well-defined line of showers and thunderstorms are ongoing across FL-GA-SC while the more blue-dominant and smoother reflectivity across TX-AR-LA indicates likely snow, especially with below freezing temperatures present over much of that region. A small area of potential ground clutter pops up over central Florida. This is an issue that comes up sometimes when a radar beam scatters and deflects off of the ground or other objects besides hydrometers, so there likely is little to no precipitation actually occurring over that area. Based on where the warm, moist airmass is with ongoing convection and the position of the trough feature, I wanted to take a look at a 12z sounding from a station in the warm sector. This 12z sounding is from Tallahassee, FL (TLH). From the surface up until ~700mb the red temperature profile and green

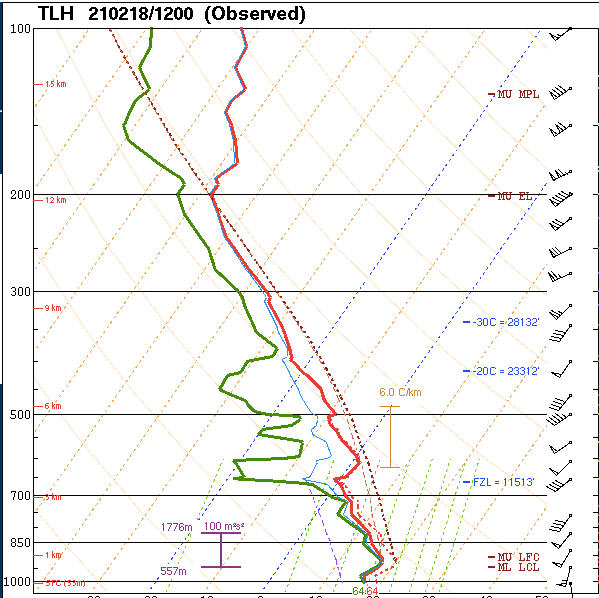
dewpoint profile are nearly touching which indicates a very moist environment which makes sense based on Airmass RGB and Water Vapor imagery. The wind profile to the right shows some strengthening and turning of the winds with height which hints at wind shear being a factor in helping to build and strengthen any thunderstorms that develop in the area. The positioning of the trough based on Airmass RGB, Water Vapor, and 300mb analysis show strong SW upper-level winds over the region which will help to turn the warm southerly surface winds with height and aid in building more convection later on in the day.

The Great Lakes and the Greater Cold (author: Dorien Minor)

Figure 1: MODIS aboard the Aqua satellite captures a combined visible-infrared imagery (with corrected reflectance, resolution of 250m) of the Great Lakes region on February 20, 2021. Source: NASA Earth Observatory.


After an abnormally warm start to winter, a recent cold air outbreak affecting a large swath of the interior United States has contributed to a noticeable spike in ice coverage across most of the Great Lakes. The image above was acquired by the Moderate Resolution Imaging Spectroradiometer (MODIS) on NASA’s Aqua satellite on February 20, 2021. This false-color image uses a combination of shortwave infrared, near-infrared, and visible bands that help distinguish ice coverage from snow, liquid water and clouds. Sea ice is denoted in the pale blue regions within the major bodies of water (dark blue to black), and is in its highest concentrations in western Lake Superior, Green Bay (northwest of Lake Michigan), and underneath the cloud cover over Lake Erie.

Figure 2: 1973-2020 average ice concentration compared to 2021 for the Great Lakes, updated February 20, 2021. Source: Great Lakes Surface Environmental Analysis (GLSEA).


According to measurements taken by the Great Lakes Environmental Research Laboratory (GLERL), only 2.81% of the Great Lakes were ice-covered to usher in 2021, and increased to 10.65% by February 1, 2021. In an average year, between 20 and 40 percent of these bodies of water would contain ice by February 1 before reaching its respective peak in ice coverage by late February. By February 20, 2021, total ice coverage across the Great Lakes jumped to 44.71%, which brought ice concentrations to near-average totals for this time of year. Compared to the 2019-2020 winter season, a similar lack of cold air throughout the season kept the maximum ice coverage under 20% the entire season, which was below the average ice concentration for the Great Lakes.

Figure 3: Loop of mean sea level pressure (MSLP) over the Great Lakes from 00Z 13 February 2021 to 00Z 19 February 2021 using a Rapid Refresh Reanalysis product. Higher values of MSLP (high pressure systems) are denoted in brighter colors, whereas lower values (low pressure systems) are denoted in cooler colors.


What’s helping to finally bring this cold air over the Great Lakes? Beginning on February 6, 2021, a series of high pressure systems would originate over central Canada and the northern Great Plains, with the most potent of these systems affecting all of the Great Lakes beginning on February 13, 2021. In a high pressure system, also known as an anticyclone, the air around the system flows in a clockwise pattern in the Northern Hemisphere. If an anticyclone is located to the west of a region, as was the case throughout the majority of the week, cold air will enter the region from the north, and will continue to be pumped into the region until the upper level dynamics either weakens the high pressure system or moves it out of the area. At its peak, the latest high pressure system over the northern Great Plains reached a mean sea level pressure of 1046 millibars on February 14, 2021, which corresponded to low temperatures ranging from -25 degrees to +10 degrees Fahrenheit along the shores of the Great Lakes, with lower wind chill values. As of February 20, 2021, this high pressure system will begin to move eastward, which will allow for warmer temperatures to enter the region through the early portions of next week, although not warm enough for ice formation to decline just yet.

Massive Winter Storm Stretches Across the Southeast (author: Hannah Levy)

The Weather Prediction Center is anticipating a messy 24-hours from 02Z 14 February through 02Z 15 February 2021. The map indicates a large swath of the Southeast receiving rain, mixed precipitation, freezing rain, and/or snow, as shown in Figure 1. The travel impacts will likely be vast, though this is dependent upon the type of precipitation that falls.

Figure 1: Weather Prediction Center national forecast chart, valid 02Z 14 February through 02Z 15 February 2021. 


Visible satellite imagery shows thick clouds blanketing much of the United States, as shown in Figure 2. Across the country, there is a general lack of convective activity, evidenced by the flat and uniform appearance of the cloud cover. There is some minor convective activity bubbling up from the Gulf of Mexico and making landfall over the Mississippi/Alabama coast. This may provide some moisture to the winter storm system. However, the main story with this system lies with the atmospheric profile, which determines what precipitation will fall as rain, freezing rain, sleet, or snow.

Figure 2: GOES-16 visible satellite imagery, valid 12:16Z through 16:26Z 14 February 2021.


This temperature difference can be deciphered in part by examining radar imagery, illustrated in Figure 3. Off the east coast, the precipitation is falling as rain. The scattering of the radar rays by raindrops makes this precipitation appear splotchy. This can be contrasted with the precipitation that’s falling as snow over the Great Plains, as this has a smoother appearance. The trouble with using radar to forecast an event such as this winter storm is that it’s very difficult to tell areas of freezing rain and sleet on radar imagery. This is where the atmospheric temperature profile needs to be considered.

Figure 3: Radar imagery, valid 17:11Z 14 February 2021.


At the intersection of the snow/sleet/freezing rain line sits Nashville, Tennessee. A forecast skew-T sounding for 04Z 15 February shows a very small warm nose preventing the precipitation from falling as snow. The frozen precipitation will fall through the atmosphere until it reaches approximately 840mb. At this point, it will melt, as the atmospheric temperature is above freezing. Around 870 mb, the precipitation will freeze again, as the surroundings are below freezing down to the surface. The size and altitude of the warm nose determines whether the precipitation falls as either freezing rain or sleet. As a result, the impacts of this winter storm are extremely difficult to forecast.

Figure 4: Forecast skew-T sounding for Nashville, Tennessee, valid 04Z 15 February 2021.


Washington State Snowfall (author: Charlotte Carl)

Washington and other areas of the Northwest started receiving snowfall on Thursday, February 11th in the evening and continued to receive snowfall into the subsequent weekend. The highest amounts the area was predicted by the local NWS branch was around one foot around in the Cascades of Pierce and Lewis Counties. Closer to the coast, the area received a mixture of snow, sleet, and freezing rain, as shown by the radar taken from accuweather at 17Z on Friday February 12th. As of Saturday, February 13th at 18Z, a majority of the state of Washington still had light to moderate snowfall. The majority of Washington and Oregon as of 18Z on Saturday February 13th in either a winter storm warning or a winter weather advisory.

Figure 1: Accuweather Radar screengrab taken at 17Z on Friday, February 12th. This radar shows snow in parts of Washington and Northern Oregon and a combination of snow and ice on the coast.


There was a low-pressure system off of the coast of the northwest that caused this snowfall upon its arrival to the states. As of 15Z on Friday February 12th the mean sea level pressure of center of the low was 1007 millibars, the ‘L’ seen directly off of the Oregon coast on the WPC surface level analysis map. As displayed on the water vapor image taken at 15Z on Friday February 12th. the frontal boundary caused by the low has very high and cold cloud tops, the frontal boundary was also followed by a region of dry air, typical of a cold front like this. There was another low that followed the first that was responsible for bringing the second round of snow to the Washington and Northern Oregon coast. At the center, this low has a mean sea level pressure of 990 millibars as of 15Z on Friday, February 12th, as shown by the same WPC surface level analysis.

Figure 2: GOES 17 water vapor image taken at 15:50:32Z. Shows frontal boundary in addition to an area of cyclonic motion associated with the second low off of the Canadian coast.


Figure 3: WPC Surface Analysis taken at 15Z on Friday, February 12th. This surface map shows both the 1007 millibar low off of the Oregon coast and the 990 millibar low off of the Canadian coast.


This second low the area saw was formed in exact accordance with the Norwegian Cyclone model with an occluded front sourcing from the center, a cold front branching off to the west of the occluded front and a warm front branching to the east of the occluded front. This is indicative of an extratropical cyclone being in the mature stage meaning the low is at its maximum strength and that the cyclone will begin to slow down in movement, which is what happened. The result of these lows was Washington and Oregon receiving snow that ranged from traces up to 18 inches according to the National Weather Service. The snow continued to fall and caused snow as far East as Wyoming and Colorado.