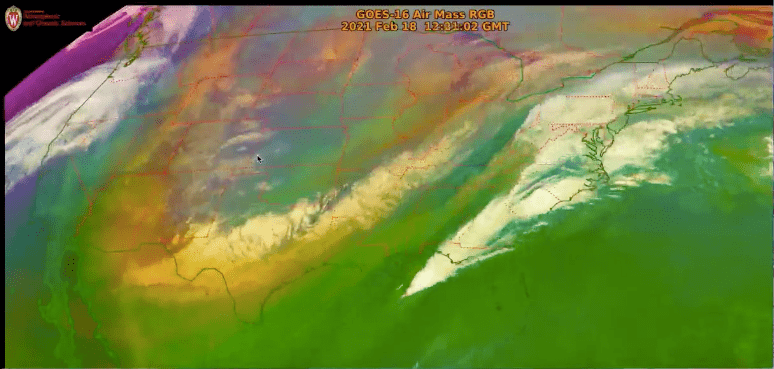
An active day was in store for parts of the Southeast US on Thursday, February 18th. A digging trough brought very frigid air south that not only kept a lot of country that was still dealing with the aftermath of a devasting winter storm earlier that week iced over, but also helped to set up a strong temperature gradient as warm, moist air advected into Florida and Southern Georgia. Airmass RGB is a type of enhanced
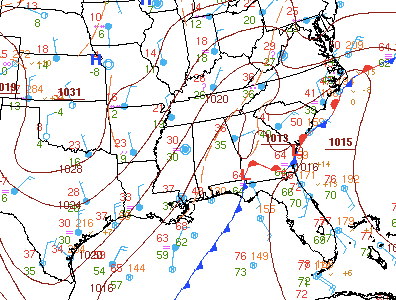
satellite imagery that helps to identify different kinds of air masses based on temperature and moisture. Greens indicate warm, moist air while blues indicate cold, dry air. The U-shaped area of orange and red indicates upper tropospheric dry air which can help to identify troughs and the jet stream. Cleary based on this image there is a boundary being set up with warmer and more moist air in the southeast with colder and drier air behind it in the central and southern plains. A surface analysis at 12z helps to confirm the established air masses and where the frontal boundary is positioned. Florida
And parts of Southern Georgia are in the warm, moist air mass and are therefore in in the warm sector of the frontal boundary (bounded by the warm front to the north and the cold front to the west) with temperatures and dewpoints in the 70’s while further west you can see that these numbers plummet into the 20’s and teens.
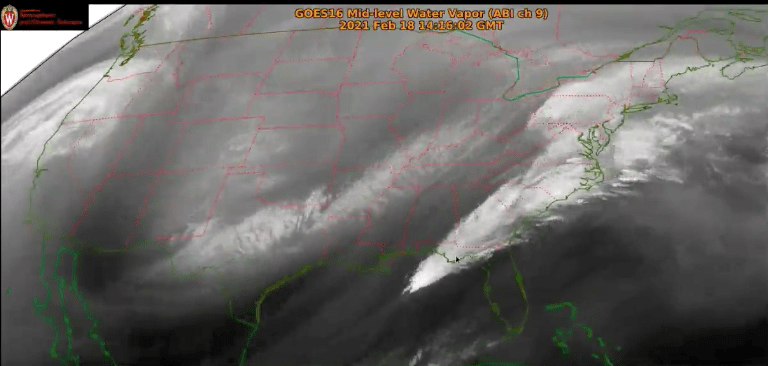
Airmass RGB was able to give a hint at where the location of the trough might be, but in order to see this more clearly here is a picture of water vapor imagery over the same area. Water vapor imagery shows you the brightness temperatures of surfaces and cloud tops, but at a specific wavelength that targets water vapor. This
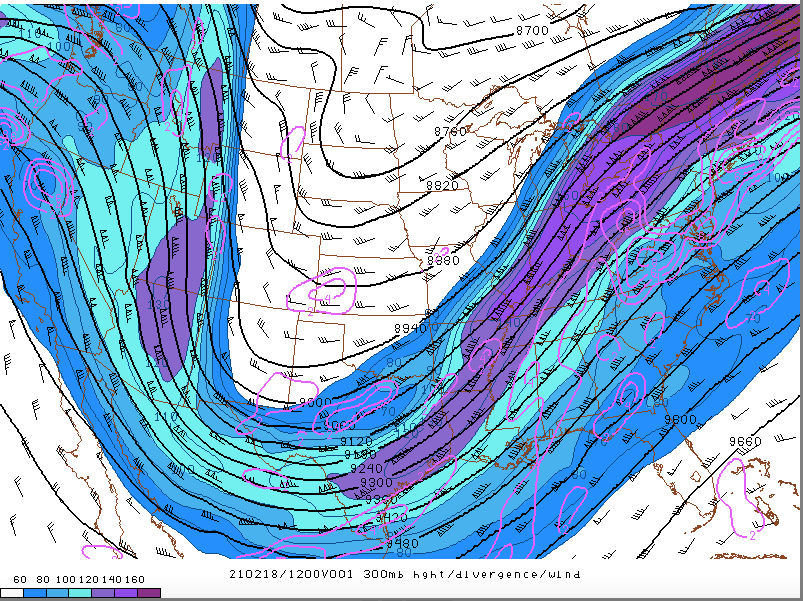
allows you to clearly see where moist air (brighter) and dry air (darker) is. This helps to further identify where a trough feature might be due to the dry upper-level air being brought down to the lower latitudes and there appears to be a similar U-shaped region as was seen with the Airmass RGB imagery. Clearly the southeast is under the influence of a warmer, moist airmass due to the very bright white colors shown over the area. A 300mb analysis map from the Storm Prediction Center at 12z confirms the location of the trough in the same general area as what was being shown on satellite.
The position of the trough will play a big role in developing convection in the southeast during the day. Strong upper-level wind associated with the trough are shown with the fill pattern with 80-100kt winds over Florida and Georgia.
Now that the warm/cold airmasses and the location of the trough have been confirmed, let’s see where any precipitation is occurring. This is IR imagery which
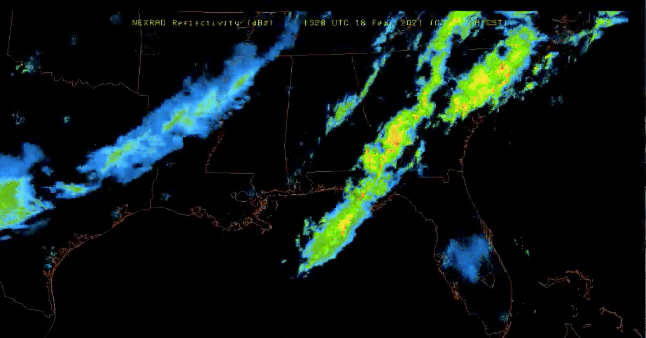
shows brightness temperatures of surfaces and cloud tops, like with water vapor, except that these measurements are based on outgoing longwave radiation emitted from these surfaces which means that the brighter the feature, the colder the surface and the darker the feature the warmer the surface. This is helpful with identifying convection because bright objects indicate high (cold) cloud tops which is a sign of developing convection. There appears to be a SW-NE line of convection stretching from the Gulf of Mexico up towards the Mid-Atlantic and Northeast which is likely associated with the cold front shown on the 12z surface analysis shown earlier. NEXRAD radar reflectivity
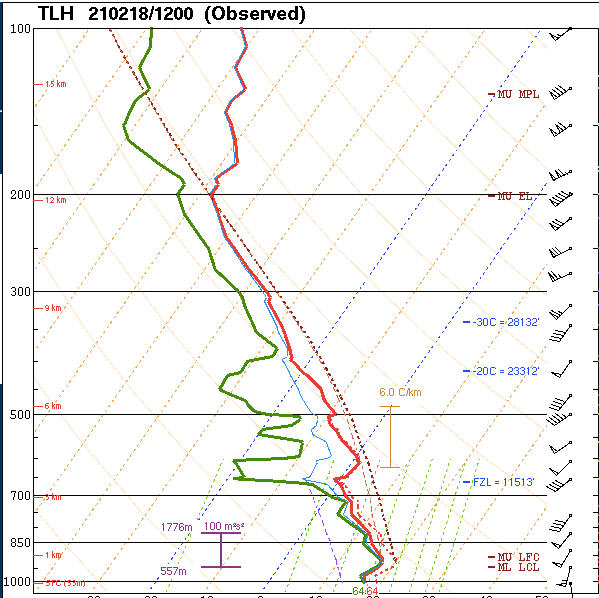
From ~13z that morning confirms the presence of convection across the southeast. A more cellular and well-defined line of showers and thunderstorms are ongoing across FL-GA-SC while the more blue-dominant and smoother reflectivity across TX-AR-LA indicates likely snow, especially with below freezing temperatures present over much of that region. A small area of potential ground clutter pops up over central Florida. This is an issue that comes up sometimes when a radar beam scatters and deflects off of the ground or other objects besides hydrometers, so there likely is little to no precipitation actually occurring over that area. Based on where the warm, moist airmass is with ongoing convection and the position of the trough feature, I wanted to take a look at a 12z sounding from a station in the warm sector. This 12z sounding is from Tallahassee, FL (TLH). From the surface up until ~700mb the red temperature profile and green
dewpoint profile are nearly touching which indicates a very moist environment which makes sense based on Airmass RGB and Water Vapor imagery. The wind profile to the right shows some strengthening and turning of the winds with height which hints at wind shear being a factor in helping to build and strengthen any thunderstorms that develop in the area. The positioning of the trough based on Airmass RGB, Water Vapor, and 300mb analysis show strong SW upper-level winds over the region which will help to turn the warm southerly surface winds with height and aid in building more convection later on in the day.


