While it was a relatively quiet weather week across most of the United States, a squall line that moved through Georgia during the early hours of Monday, March 1st spun up a quick EF-1 tornado in Clayton County around 1100 UTC. The tornado only lasted about ¾ of a mile and was on the ground for less than a minute. The WPC surface analysis map from 09Z March 1st, 2021 shows a cyclone centered over Eastern Canada (Figure 1). A cold front extends from the center of this low to the southwest where it ends in Texas. This front will serve as the lifting mechanism for storms to develop as it marches through the Southeast.
 Figure 1: WPC surface analysis map of the United States from 09Z 1 March 2021. Source: WPC Surface Analysis Archive
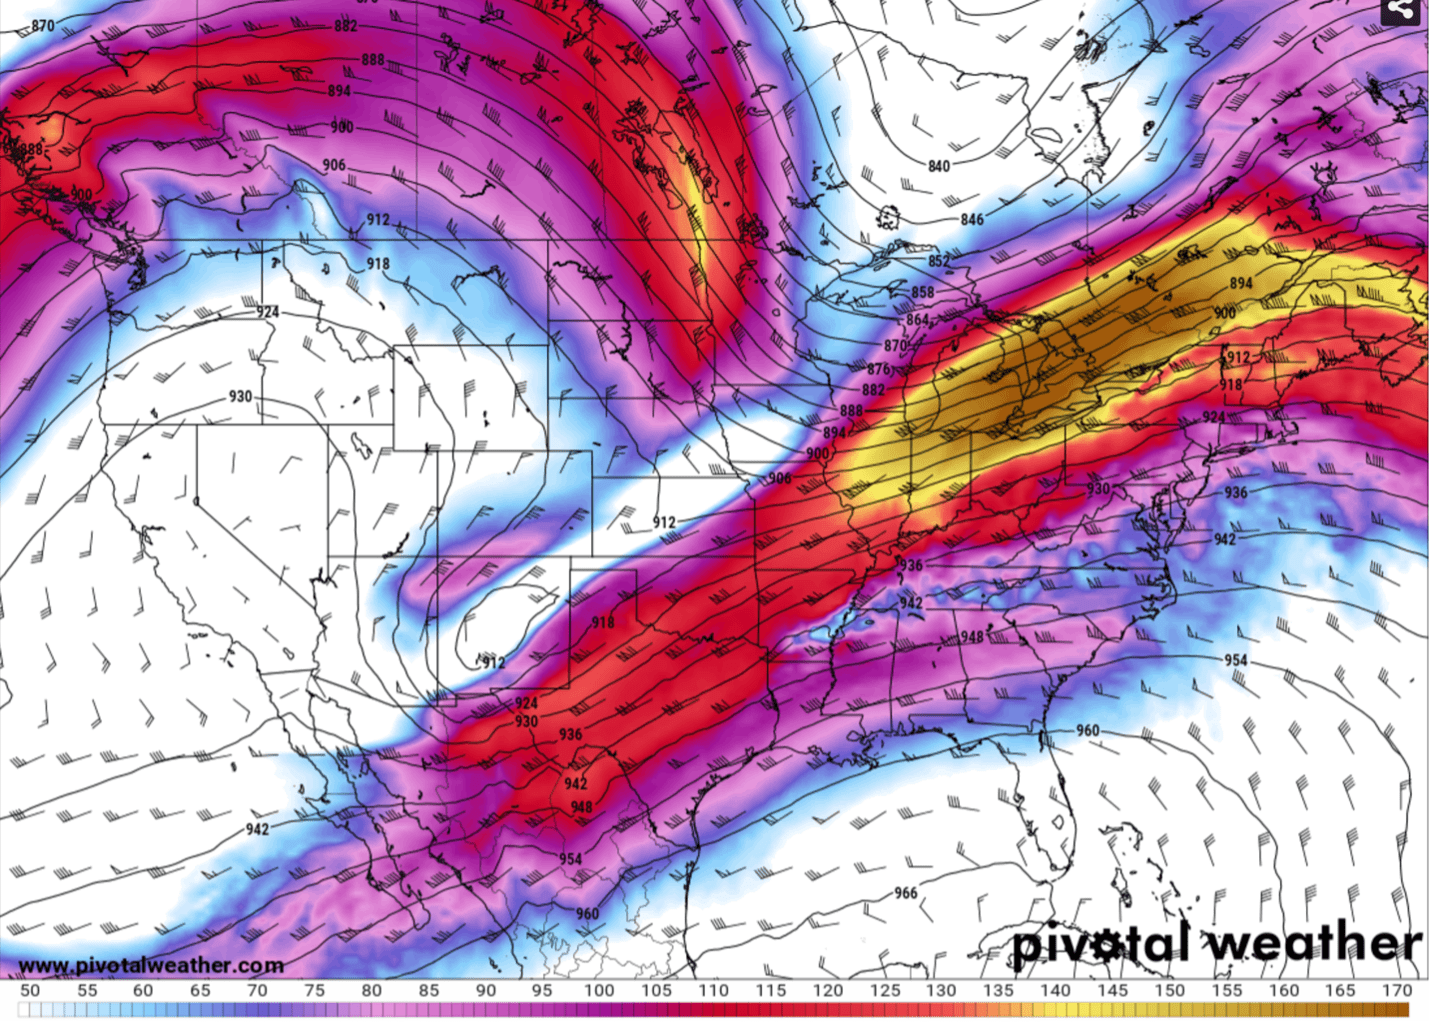
The synoptic scale environment, or large-scale atmospheric environment, was favorable for cyclone maintenance and strengthening at this time. The reason for this is because of two main features at play: a trough located over the Great Lakes Region and a jet streak over the Northeastern US and into Canada (Figure 2). The surface cyclone was located downstream of the trough, an area where air diverges, or spreads outward, aloft. This causes air from the mid-troposphere to fill in the gap where the previous air above was, inducing upward vertical motions. This in turn strengthens the low-pressure system. In addition to this, the cyclone is located in a favorable environment for strengthening with respect to the jet streak. The cyclone is located in the left jet exit region, which is also a region where air diverges. For the same reasons as the trough, this will induce upward vertical motions and enhance the surface cyclone.
 Figure 2: Model displaying 300 mb height (black contours, dam) and wind speed (fill pattern, knots) from 09Z 1 March 2021. Source: Pivotal Weather
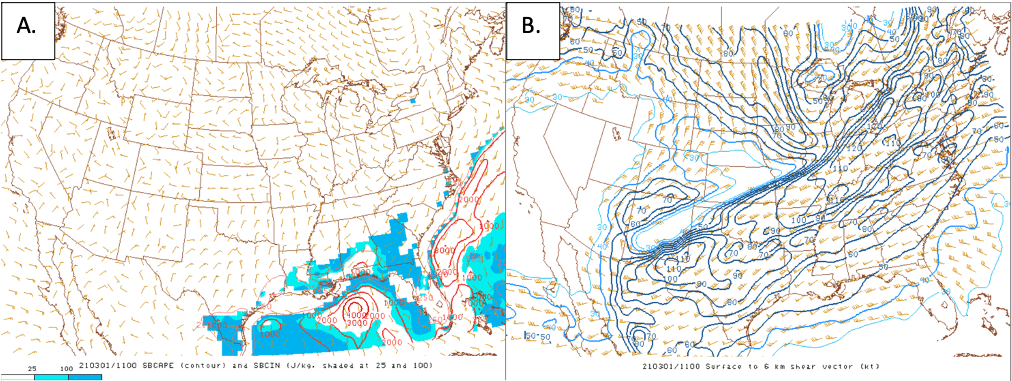
While the synoptic environment is favorable for surface cyclone strengthening, this cannot be attributed to the development of the tornado because the surface cyclone is so far away from GA. The mesoscale environment, or smaller-scale atmospheric conditions, must be analyzed to see what led to this short-lived EF-1 tornado. Two key variables in the mesoscale environment can be looked at to determine how unstable the atmosphere was around the time the tornado formed. The first variable is convective available potential energy (CAPE). CAPE is essentially how much “fuel” there is in the atmosphere for the thunderstorm to use. At 11Z, no significant values of CAPE were present over Clayton County (Figure 3A). Since CAPE was not a factor, something else must have led to an unstable environment to allow for this tornado. The second variable that will be analyzed is 6 km wind shear. Shear values of 60 and 80 knots are seen across Central and North Georgia at 11Z (Figure 3B). Even with little to no CAPE, this strong shear environment is sufficient enough for a tornado to form.
 Figure 3: This panel displays mesoscale variables used in determining atmospheric instability. Figure 3A displays SBCAPE (red contour, J/Kg, 1000 J/kg intervals) and SBCIN (fill pattern, shaded at 25 and 100 J/kg) at 11Z 1 March 2021. Figure 3B displays 6km wind shear (blue contours, knots, 10 knot intervals) at 11Z 1 March 2021. Source: SPC Mesoscale Analysis Archive
Now that we understand the role the synoptic and mesoscale environments played in forming this tornado, satellite and radar imagery can provide us a clear image of exactly what happened and where it happened. Composite radar reflectivity imagery allows us to track the precipitation within the squall line and see how intense it is (Figure 4). The squall line feature is clearly identified in this imagery as the band of red and yellow. These colors are associated with higher dBZ values (larger rain droplets) which indicate more intense precipitation. This radar image shows the squall line moving to the southeast with lighter precipitation trailing behind. Not only can radar provide information about precipitation, but radial velocity imagery can provide valuable information on the motion of air in the atmosphere. The radial velocity image depicts primarily blue and red coloring where blue indicates motion towards the radar and red indicates motion away from the radar (Figure 5A). The motion of the system appears to be northwesterly based upon the shading pattern, and this can be confirmed by surface wind data (Figure 5B). In addition, radial velocity imagery can be very useful when identifying tornadoes in a supercell because the rotating air will appear as a tight region of blue and red on the image. While the tornado event on Monday was not from a supercell, the radial velocity imagery still displays a region of instability around Atlanta as indicated by the region of blue and red shading. This region of instability is near Clayton County where the tornado on Monday occurred. By looking at the synoptic and mesoscale environments along with radar imagery of the actual event, it can be better understood why an EF-1 tornado spun up in Clayton County GA.
 Figure 4: This is a loop of composite radar reflectivity data (fill pattern) from 9:55Z to 11:55Z on 1 March 2021. Source: UCAR Image Archive
 Figure 5: This panel displays radar data along with modeled surface wind data. Figure 5A displays radial velocity data (fill pattern). Figure 5B displays surface wind magnitude and direction (wind barbs) and surface temperature (fill pattern). Source: NCAR and Pivotal Weather

