
 GOES 16 Band 9 (Mid-Level Water Vapor)
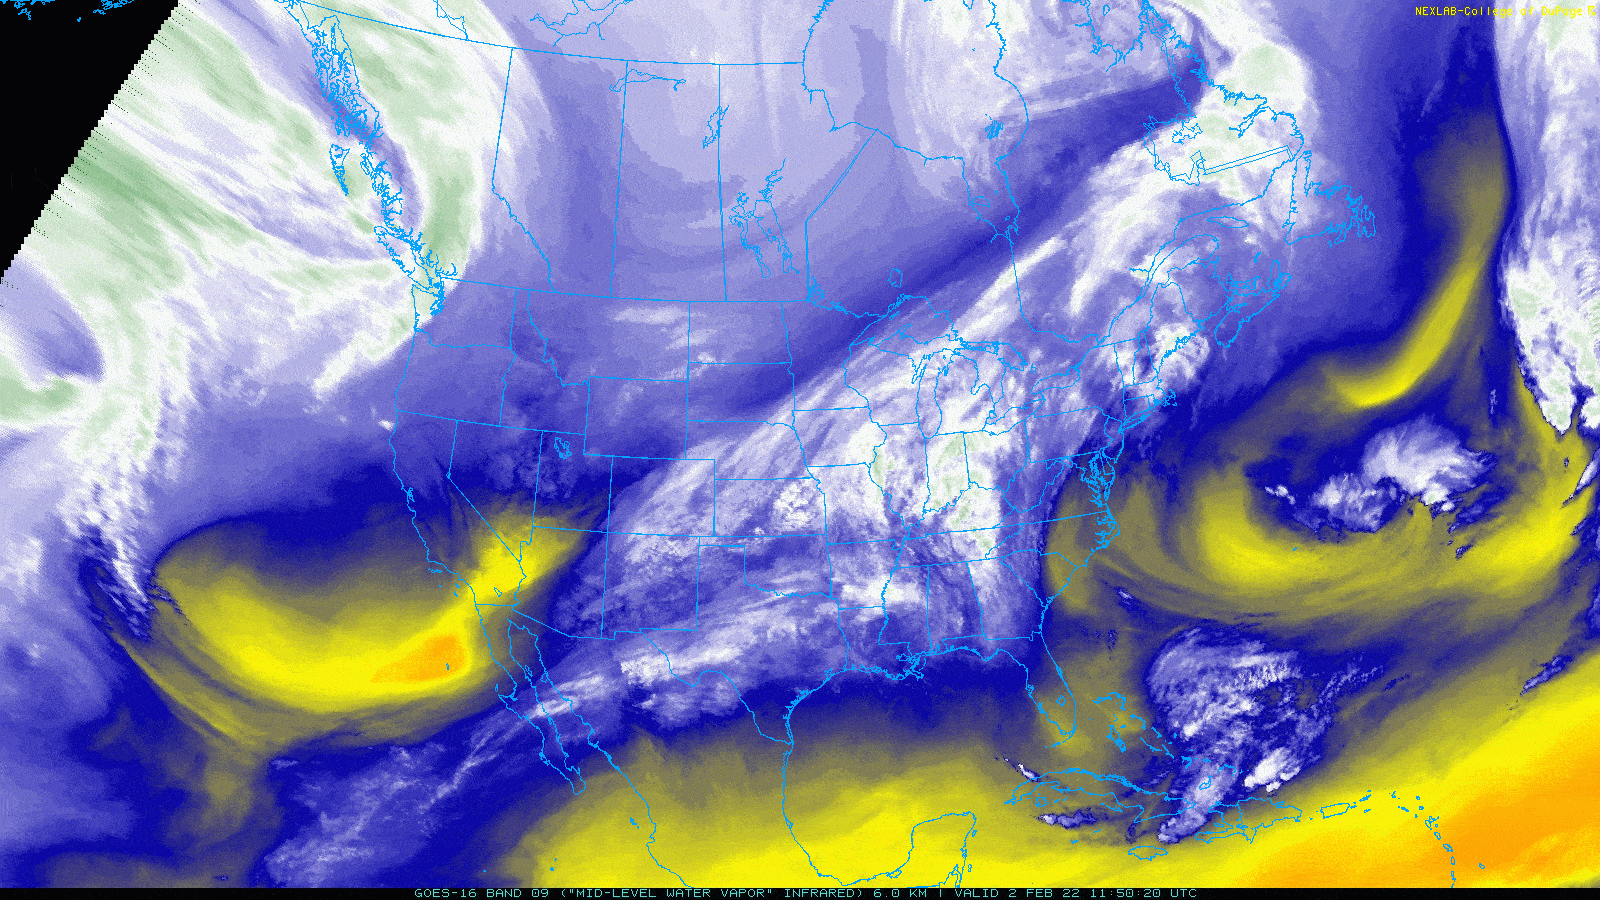
On February 3rd 2022, a line of severe storms moved across Mississippi into western Alabama. The storm spawned 5 tornadoes total, with two being EF-2 category twisters. This was notable as it occurred during the winter months instead of during the spring like expected. Above is a time loop of the water vapor images taken of the storm from 7am February 2nd through 7am February 4th. This figure does a wonderful job of depicting the warm, moist air advection from the Gulf of Mexico ahead of the front with dry, cooler air following directly behind it. The moisture from the Gulf helped fuel this storm as it progressed eastward.
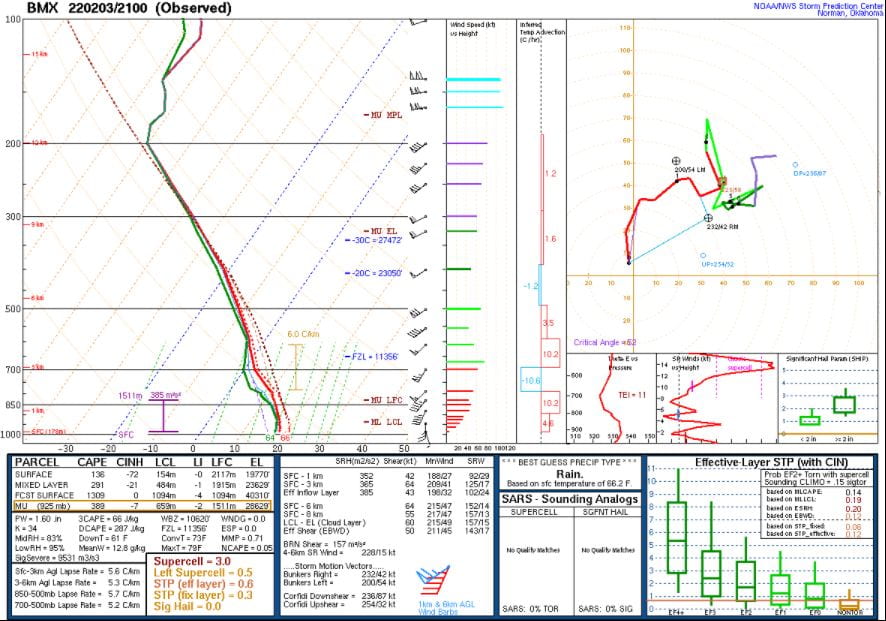 Sounding via NOAA/NWS from 3pm CST 3 February 2022
The following sounding measurements were taken via weather balloon at 3pm CST, approximately an hour after the most robust tornado touched down in Forkland, AL and stayed grounded for approximately 26 miles until it arrived in Sawyerville, AL. The solid red line on the right side of the sounding represents the vertical temperature profile while the solid green line on the left side represents the vertical profile for dew point. The temperature/dew point values are plotted on an angled axis seen on the horizontal axis at the bottom of the graph. The more rightward the line on the graph, the higher the value. As can clearly be seen, the dew point line and temperature line are very close, displaying that the air is highly saturated if not fully saturated at some altitudes (when the lines overlap). The warmer air with more moisture near the surface serves to increase instability, because this air has a tendency to rise upward, which is a key component for setting the scene for tornadic activity.
In order to accurately monitor the formation and duration of the tornadoes on this day, meteorologists relied heavily upon dual-polarization (dual-pol) radar stations surrounding the region in western Alabama and east Mississippi. Dual-pol radar provides better estimates of the shape and size of targets the radar picks up on by sending out both horizontal and vertically oriented pulses. Part of the dual-pol upgrade to the existing WSR-88D stations included the newfound ability to measure the correlation coefficient (CC) between the sizes of target objects. This essentially measures the uniformity of the targets measured so rain would have a very high CC while a non-weather related target like a flock of birds or insects would have a considerably lower CC. When trying to determine where a tornado has touched down, it is useful to look for where the CC drops drastically as this often is indicative of debris being uplifted by the tornado. This is known as a ‘debris ball’ and one can spot it on a CC radar image by looking for sharp drops in CC in a concentrated area surrounded by more uniform targets with a high CC (rain, etc.). In the image below, the debris ball is the green portion of the CC image amidst much higher (red) CC values.
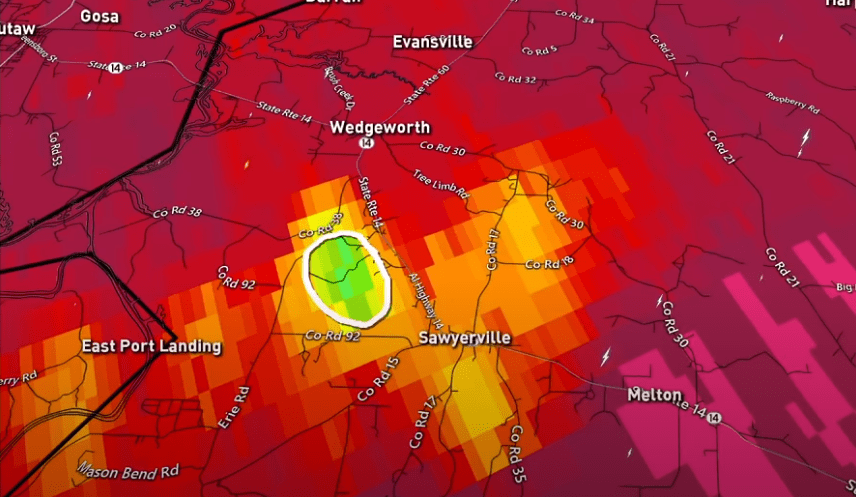
Correlation coefficient map indicating ‘debris ball’ from Forkland-Sawyerville EF-2 tornado
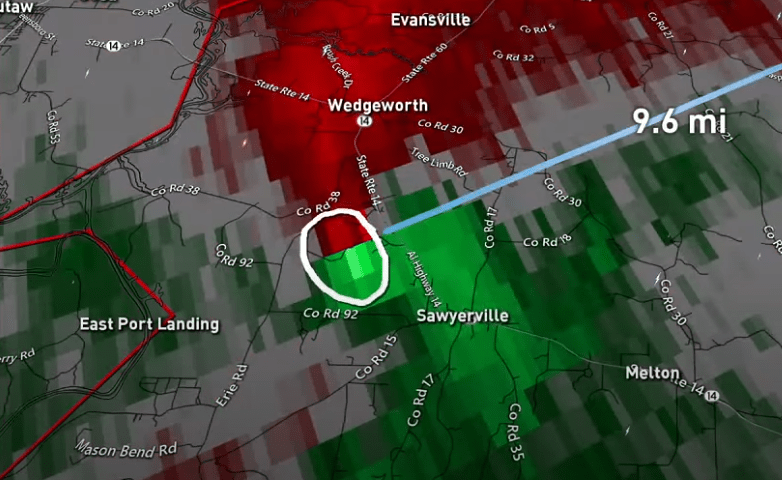
Tornadoes are made even more apparent to meteorologists when looking at base velocity maps. These maps color code where wind is moving away from the radar station and where it is moving towards it. The direction can only be measured in relation to the direction of the beam so what is plotted is always an underestimate of the actual wind speeds as it only captures a component of the wind velocity. The green colored areas show where the wind is moving towards the station while red indicates it is moving away from the station. Below is the base velocity map from the exact same time as the correlation coefficient map above. They both have circles around the area indicative of a tornado on the ground. In the base velocity map, a coupling between red and green with a high brightness, meaning that the reflectivity is higher, means there is significant circulation in that area.
Though the tornado was detected and monitored in this way for the duration of the storm, it was difficult to pinpoint its exact location as this area of Alabama is far enough removed from surrounding radar stations that the beams monitoring the area are abnormally high. This is the case because beams are sent out in straight lines angled upward while the Earth is curved so as the beam covers more horizontal distance, it only ‘sees’ what is happening higher and higher in the atmosphere. This means that detected activity closer to the surface is more difficult to measure and it could be that the tornado showing up on radar is actually closer to the station than anticipated because the beam is measuring what is happening at a higher altitude.