From March 12th to March 13th, 2022, a late winter season low-pressure system developed over the southeastern United States. While not abnormal for this part of the world this time of year, this particular low-pressure system would end up developing into a significant Nor’easter that brought lots of precipitation across the eastern United States (including a lot of snowfall for the New England states), below-freezing temperatures to areas as far south as central Georgia and Alabama, and the primary focus of this discussion, a moderate severe weather outbreak to Florida. Due to modern radar and satellite technology, it is possible to identify elements related to the development and life cycle of both surface low-pressure systems and severe weather events from multiple perspectives.

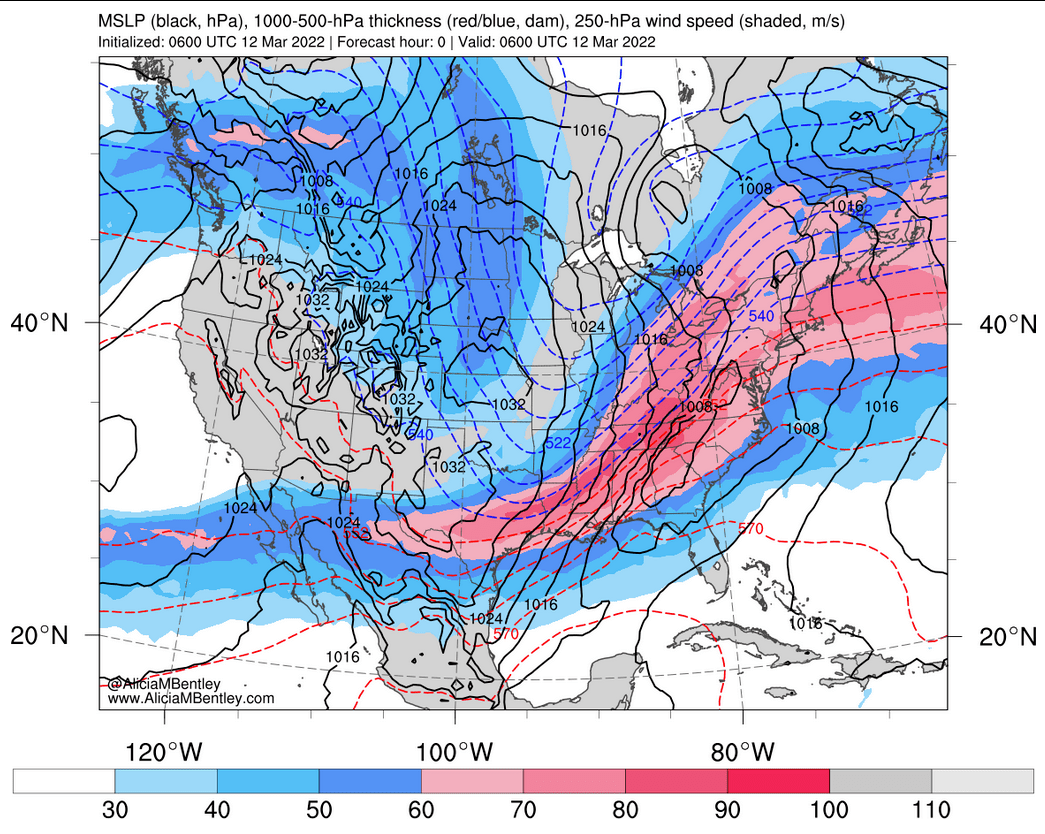
Figure 1: 250 millibar jet stream map from 0600Z 12 March 2022, where the higher values of wind speed (in m/s) are shown in pink. Sea-level pressure is also shown in the black contours every 4 mb, and 1000-500 thickness contours are shown in the dashed red and blue contours every 6 meters. (Source: Alicia Bentley)
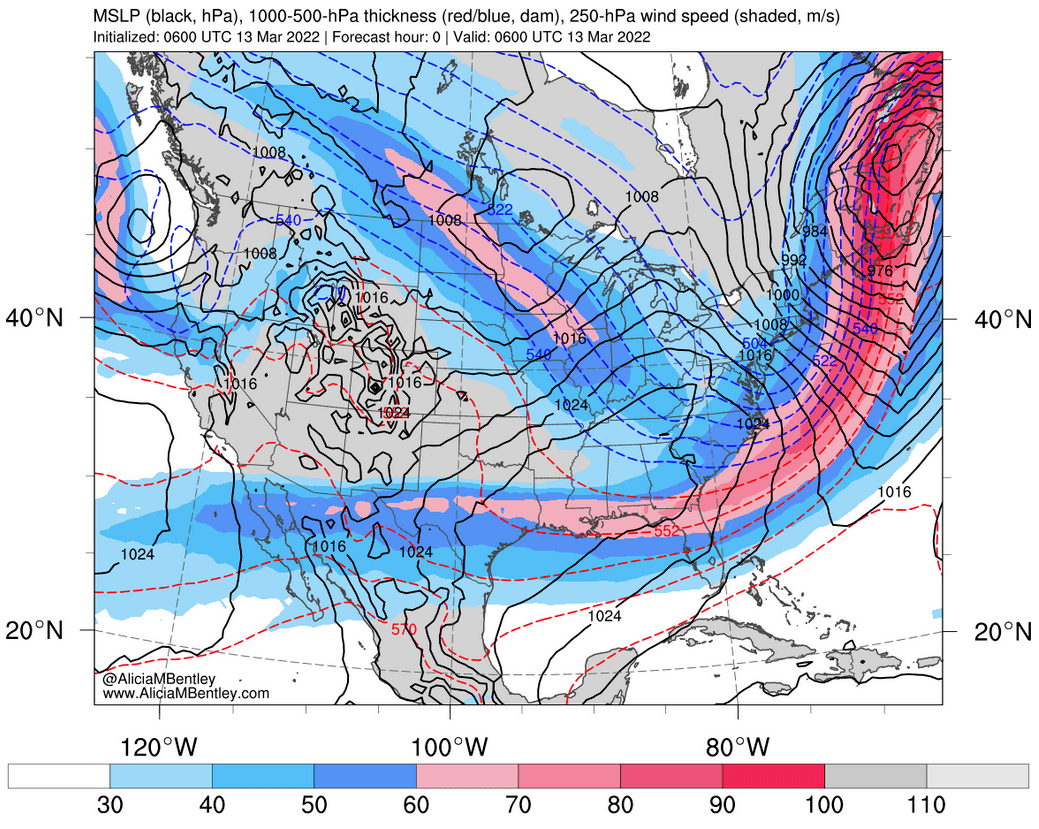
Due to factors such as a strong trough/ridge structure associated with this system, this Nor’easter was able to rapidly strengthen due to significant upward vertical motion in the mid-troposphere, which resulted in this surface cyclone undergoing bombogenesis on March 12th, 2022. Figure 1 above shows this system at an early stage of its development, at 06Z (1 a.m. EST) on March 12th. At the time, while the exact minimum pressure measurement is not displayed, Fig. 1 shows that this system was at a modest sub-1008 millibar (mb) low, something that would quickly change over the next day and a half. Figure 2 below shows the system 24 hours later, at 06Z (1 a.m. EST) on March 13th. During this time, the system had dropped to a sub-960 mb low, which was a pressure decrease of around 48 mb in 24 hours, far exceeding the threshold for a system to be declared a bombogenesis event, which is a pressure drop of 24 mb in 24 hours.

Figure 2: 250 millibar jet stream map from 0600Z 13 March 2022, where the higher values of wind speed (in m/s) are shown in pink. Sea-level pressure is also shown in the black contours every 4 mb, and 1000-500 thickness contours are shown in the dashed red and blue contours every 6 meters. (Source: Alicia Bentley)
As mentioned previously, this rapid developing system led to a moderate severe weather outbreak in Florida, which included 4 tornadoes and many additional high wind reports, which can be seen in Fig. 3 below. This outbreak consisted of 3 EF1 tornadoes and one EF0 tornado. Fortunately, no fatalities or injuries as a result of these tornadoes were reported, but there were still other effects such as property damage, downed trees, and downed powerlines.

Figure 3: Storm reports for 12 March 2022. (Source: SPC)

Figure 4: Sounding/Skew-T data from Tampa Bay, taken at 1200Z 12 March 2022. (Source: NWS)
Figure 4 above shows sounding data of the Tampa Bay area (on the western coast of Florida) from 12Z (7 a.m. EST) on March 12th. There is quite a lot of data that can be interpreted from these plots and tables, specifically in the bottom left, that all ultimately highlight the unstable environment that was present in Florida just before and during the severe weather outbreak. First, we can see that there was over 2200 Joules per kilogram (J/kg) of Convective Available Potential Energy (CAPE) present, with minimal Convective Inhibition (CIN) to counteract this. A Lifted Index (LI) value of -4 was also measured. All of these factors point to a moderately unstable environment. This is further supported by the environmental lapse rate values in the very bottom left of Fig. 4. They were measured to be between 4.8 and 5.9 degrees Celsius per kilometer, which is higher than the moist adiabatic lapse rate (3.3 degrees C/km) but lower than the dry adiabatic lapse rate (9.8 degrees C/km), which is an indication of a conditionally unstable environment. In the lower center of the figure, we can see that a highly sheared environment was present, with values between 40 and 80 knots throughout the troposphere, which is ideal for severe weather development. Lastly, the “Supercell” value in the bottom left of the figure was measured to be 19.9, which is a very significant indicator for the possibility of supercell-inclusive severe weather. To summarize, there was significant instability present in the region along with a moist environment leading up to the severe weather event, which enabled atmospheric lifting and rapidly developing convective activity.

Figure 5: Base Radar reflectivity map from 1250Z 12 March 2022. Blue and green colors are lower values of reflectivity (in dBZ) while yellow and red colors are higher values of reflectivity, which correlates to a higher precipitation rate. (Source: National Severe Storms Laboratory)
Using radar reflectivity, it is possible to view precipitation data from this event. Figure 5 above shows an archived base reflectivity map from 1250Z (7:50 a.m. EST) on March 12th. Using this map, we are able to see the line of severe storms that are just starting to impact Florida at this time due to their red and orange colors associated with a higher reflectivity value. Heavier rain and some storms are also present on this map in the Mid-Atlantic region during this time, and if we reference Fig. 3, we can see that there were many high wind reports in North Carolina associated with this. Also worth noting is the smoother blues and greens to the northwest side of this system, which is indicative of snow impacting the rustbelt states and much of the northeast during this time period, along with some minor snow bands affecting areas as far south as Alabama and Georgia. Overall, the precipitation that stemmed from this bombogenesis event affected almost the entire eastern portion of the United States.

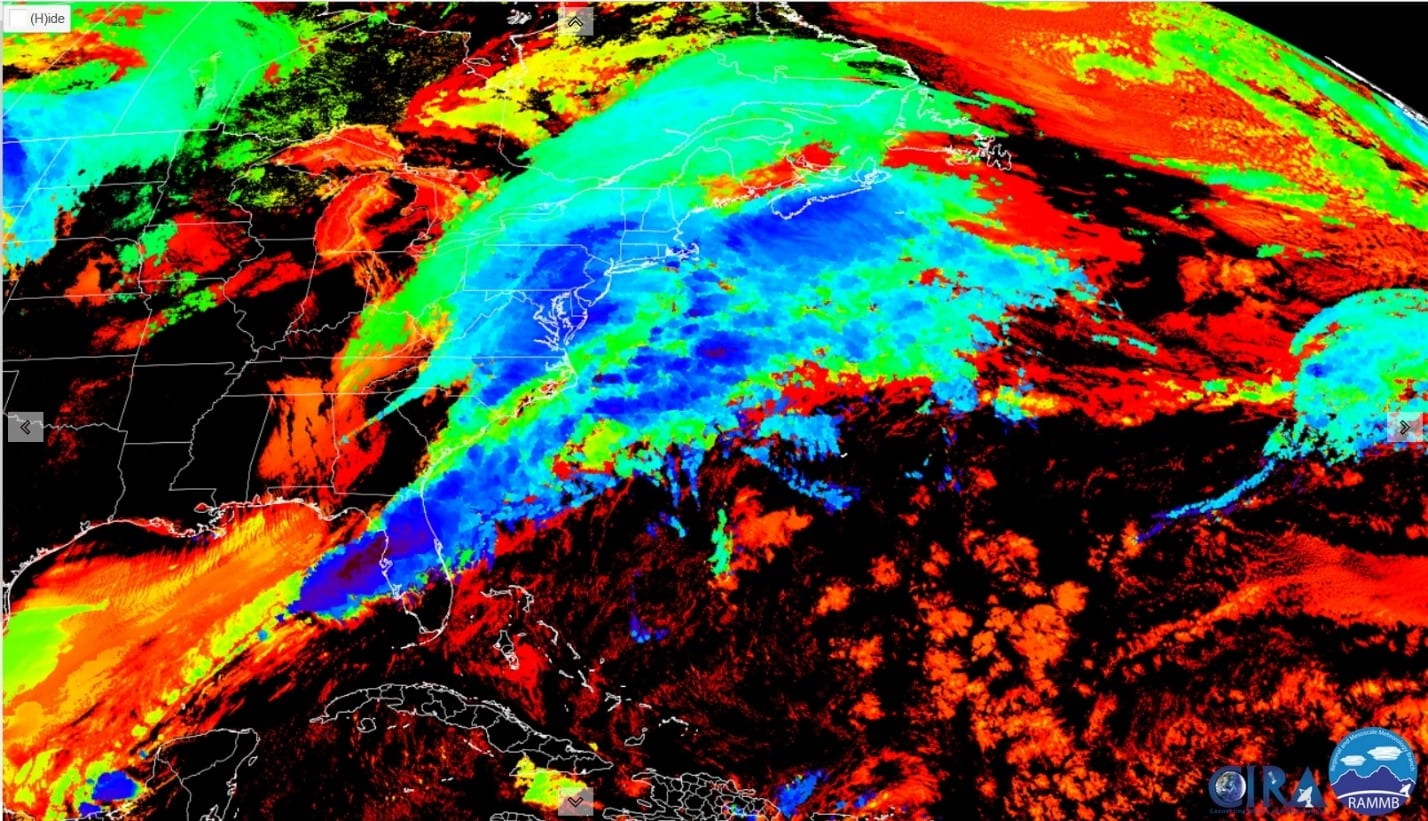
Figure 6: GOES-16 upper-level water vapor RGB product from 1250Z 12 March 2022. White and blue colors are areas with higher atmospheric water vapor content, while orange and black areas are areas with lower water vapor content. (Source: CIRA)
Using satellite data, we can get additional insight about this system. Figure 6 above shows the water vapor content of the upper troposphere at 1250Z (7:50 a.m. EST) on March 12th. On this map, blue and white colors show higher water vapor content, while black and orange colors show lower water vapor content. With this in mind, we can see that there was significant water vapor present in the atmosphere in the same area where the severe weather outbreak that impacted Florida developed (along with much of the northeast US), which, as stated before, provided an ideally unstable environment for convection to occur. Another thing worth highlighting on this map is the clear gradient from light gray/white to black/orange over northeast Georgia and central Alabama. Referencing Fig. 1, this is the approximate location of the 250 mb jet streak at this time. A jet streak can typically be identified from this type of brightness temperature gradient in water vapor satellite imagery, so this is expected.

Figure 7: GOES-16 Geocolor RGB product centered over Florida from 1250Z 12 March 2022. (Source: CIRA)
Figure 7 above shows a Geocolor map from the same time, 1250Z (7:50 a.m. EST) on March 12th. As this is a natural color imagery product, clouds are depicted in white. From this image, we can see an area just off the west coast of Florida with “bubbling” clouds associated with higher cloud tops, which is another indicator for convective activity being present in a region. Figure 8 below shows the same phenomena from a different viewpoint. In this case, the blues and purples are high cloud tops. Again, we are able to see an area just off the western coast of Florida with very high cloud tops in associated with convection. This is important, as due to satellite technology, we are able to see convective activity associated with severe weather, in some cases, before it impacts land. This allows meteorologists to provide warning to people living in areas that may be affected by severe weather events before they occur.

Figure 8: GOES-16 Cloud Top Height RGB product from 1250Z 12 March 2022. Blue and purple colors are higher altitude clouds, while orange, red, and green colors are mid-level or lower altitude clouds. (Source: CIRA)
Below is another very useful satellite RGB product, the Day Cloud Phase product. Figure 9 below (from 1650Z, or 11:50 a.m. EST, on March 12th) shows ice clouds in pink and yellow colors. Ice clouds are typically associated with clouds higher in altitude, as the higher you go in the troposphere, the colder it becomes. Especially in the warmer region near Florida, these ice clouds are another great way to tell that there are tall clouds present in the area which can be further indication of present convection. This satellite product also allows us to see snow cover on the ground, which is shown in green. In this case, we can confirm that this low-pressure system led to widespread snow cover across the Midwest and into the northeastern United States, along with the severe weather outbreak in Florida covered previously.

Figure 9: GOES-16 Day Cloud Phase RGB product from 1650Z 12 March 2022, where yellow and pink colors are higher level ice clouds, and cyan colors are mid-low level water clouds. (Source: CIRA)

