
The March 24-28th, 2021 tornado outbreak in the southern United States saw 43 confirmed tornadoes across 11 states. The three supercells on March 25th were particularly damaging, with one being a rare EF-4 tornado in Newnan, GA. The second supercell began in Mississippi and strengthened just west of Greensboro, AL, producing a large EF-3 wedge tornado (Fig. 1).

Figure 1. Storm track of the second supercell in Alabama on March 25th. The triangles represent the location of the tornado and the colored lines are an interpolation of those points. The tornado went through five counties.
The base reflectivity product shows a strong hook echo signature, which usually signifies a tornado (Fig. 2). Using this product in conjunction with the base velocity product, we can see that there are fast, rotating winds in the area of the tornado. The higher values in the center as well as the compactness of the radar pulses going away and coming towards the radar mean that there is low-level rotation.

Figure 2. Base reflectivity (left) shows hook echo signature. Base velocity (right) shows low-level rotation with higher values in the center and red (radar pulses going away) and green (radar pulses coming towards the radar).
The winds from the updraft of the supercell were powerful enough to cause a hole-like feature to appear on radar, where precipitation was suspended in the air (Fig. 3). This is called a bounded weak echo region (BWER), an area of local minimum radar reflectivity surrounded by higher reflectivity values higher in altitude.
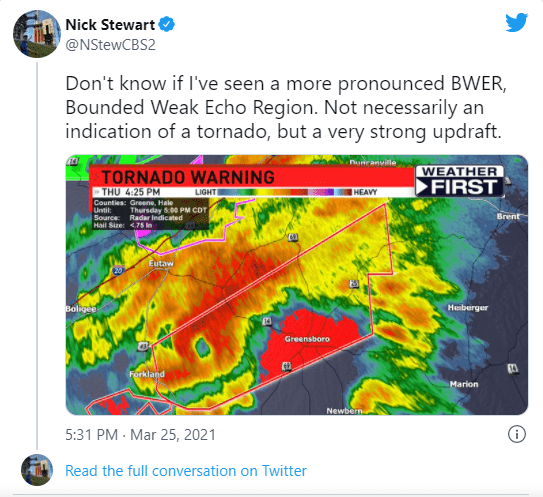
Figure 3. Bounded weak echo region (BWER). “Hole” feature that appears on base reflectivity that indicates strong updraft.
We know that this system continued to strengthen because it produced an EF-4 tornado hours later, but we can prove it by using the mid-level vorticity and surface map. When the center of maximum mid or upper level vorticity is west of the center of the surface low pressure system, the weather system tilts west (Fig. 4). This allows for a region of upper-level diverging winds to be above the surface low, further strengthening the system and supporting vertical wind shear. For this event, the maximum vorticity center is located approximately west of the surface low. We can see in th

Figure 4. When the upper-level divergence is aligned with the center of the surface low, the low pressure system will become stronger.
We know that this system strengthened over time because it produced an EF-4 in Newnan, GA hours later, but we can prove this using the mid-level vorticity and surface map. At 21 UTC, the surface low pressure system is 1004 mb (Fig. 5.). We can see from the surface map that the converging winds are carrying warm, moist air from the Gulf into the system. This would generate more lifting and instability, but we should take a look at the upper level dynamics to confirm this observation. In the 500 mb vorticity advection map, we can see that the maximum vorticity center is located approximately west of the surface low (Fig. 6). We can see in the next figure that the weather system strengthened to 999 mb low the next day at 00 UTC (Fig. 7).

Figure 5. 12 Z run of a surface analysis of the low pressure system. Circled is the center of low pressure.
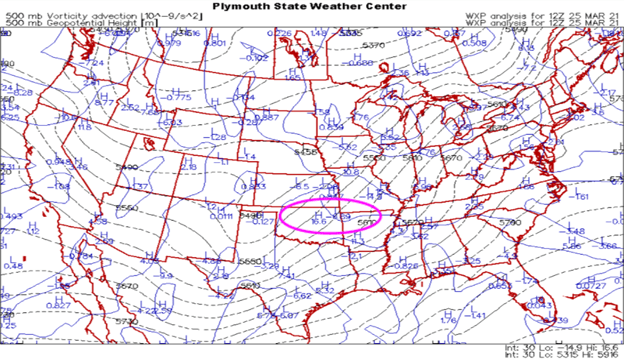
Figure 6. 12 Z run of a vorticity advection map. Circled is the center of maximum vorticity on the longwave trough.

Figure 7. 00Z run from the next day of the same weather system. Circled is the new center for the surface low.