Weeks before the start of the official hurricane season, early signs of a tropical cyclone appeared over the Florida Straits. The record breaking 2020 hurricane season was already off to the races.

Figure 1: NHC 48-hour Tropical Weather Outlook reports 1400 UTC May 14 – 1800 UTC May 16. Combination of satellite, radar, and aircraft surveillance utilized to provide most informative predictions. Precursor storm system can be seen hovering over southeast Florida
A stalled cold front over eastern Florida, the precursor to Tropical Storm Arthur, brought severe weather to the region for days, including heavy thunderstorms and hail. Maximum rainfall in Florida reached almost 10 inches, according to the National Hurricane Center (NHC). As a disturbance moved in from the Gulf of Mexico, satellite and radar began to pick up a low pressure system developing. The NHC first identified the possibility of a cyclone forming 15:00 UTC May 12, almost three weeks before the official start of the hurricane season.
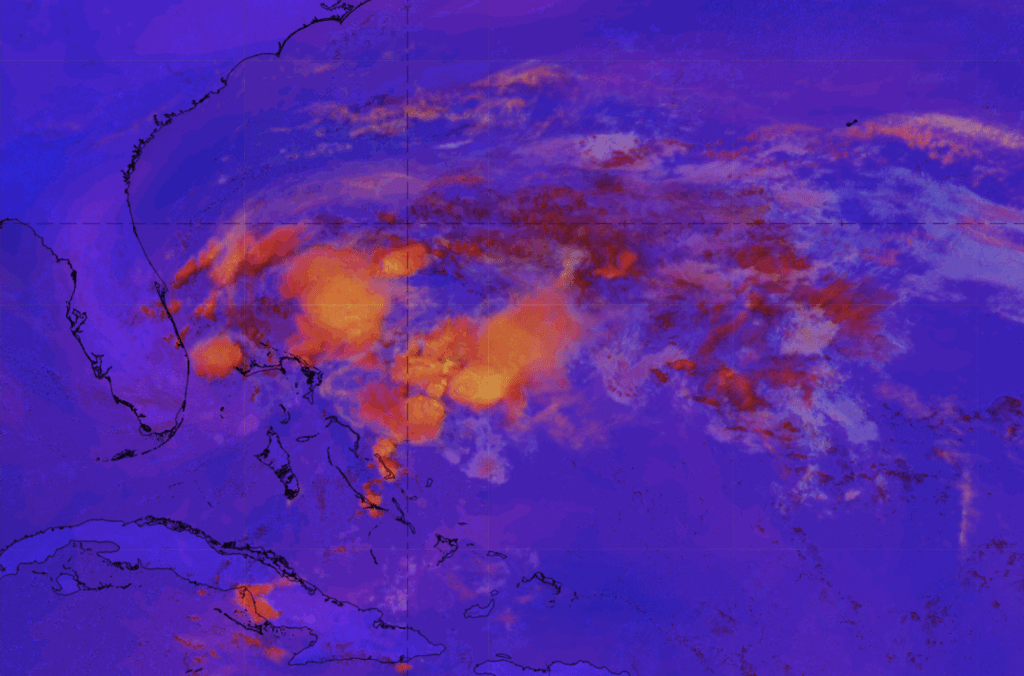
Because Arthur’s path never took it closer than 20 miles from the East Coast, remote measurements of the storm’s intensity and track were made primarily via satellites. Conditions in the upper atmosphere as the storm develops, convective flow in the atmosphere, cloud top heights, and position/motion of the storm are all critical measurements given by satellite technology. These technologies allowed authorities to give the North Carolina coast tropical storm warnings by 2100 UTC 16 May, 32 hours before the effects of the storm began.

Figure 2: GEOS-16 Convection RGB detects early signs of deep convective flow 1200 UTC May 16, indicating severe storm forming. Orange represents convective flow.
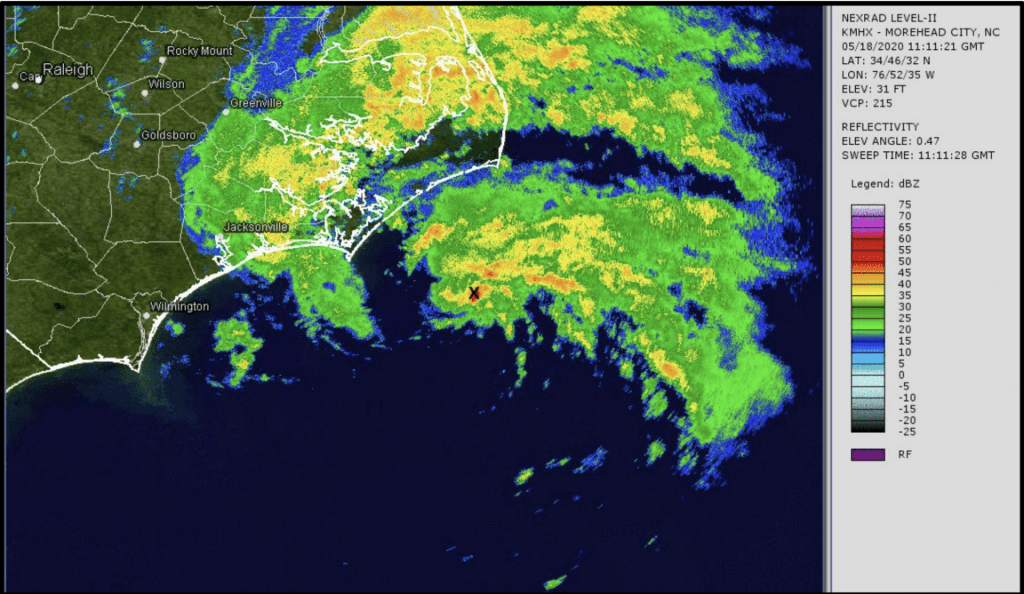
As Arthur moved north, the Gulf Stream quickly took control. Enhanced flow around the circulation of Arthur produced rip currents across the East Coast. On 17 May in Volusia County, Florida, there were 70 water rescues due to these rip currents (NHC). The warm waters and moist air of the Gulf Stream provide critical ingredients for a powerful cyclone. As Arthur moved closer to the North Carolina coast, radar imagery played a more crucial role in monitoring precipitation around population centers. Doppler radar base reflectivity images provide a real-time view of precipitation across the coast.

Figure 3: WSR-88D base reflectivity from Morehead City, NC (1111 UTC 18 May) as Arthur produces heavy rainfall in eastern North Carolina . The center of the storm is marked with an X
Arthur became extratropical and reached peak intensity (50 kt winds/990mb pressure) near North Carolina at 06:00 UTC May 19. “When Arthur moved near eastern North Carolina, it produced a swath of 3 to 5 inches of rainfall primarily across Carteret, Craven, Pamlico, and Onslow Counties, with the highest reported total of 5.01 inches,” according to the National Weather Service. The path of the storm turned eastwards and dissipated over the next few days. 2020 went on to receive 30 named storms, a record breaking year.
NHC National Weather Outlook
https://www.nhc.noaa.gov/archive/xgtwo_5day/gtwo_archive_list.php?basin=atl
NHC Tropical Cyclone Report
https://www.nhc.noaa.gov/data/tcr/AL012020_Arthur.pdf
Satellite RGB Images
http://212.232.25.232/ng-maps/

