
A late-winter storm system steadily developed throughout the week starting Sunday, March 3rd, tracking across the southern border states of the US. As it was guided by the upper air currents, conditions lined up to form a tornado the following Saturday, March 9th, which passed through Brantley County in southern Georgia, causing a sizeable amount of damage and a few injuries.

Figure 1: NWS Jacksonville’s overview of the tornado that passed through southern Georgia on March 9th, turning out to be an EF-2 rating. (Courtesy of X)
Storm systems were in the forecast for a greater part of the southern US. Starting as an unorganized low-pressure system, it followed the upper atmosphere’s wind currents–the northern subpolar jet stream–from central Texas to central Georgia, causing sporadic storms all across the south. Once meeting the southern subtropical jet, unstable atmospheric conditions allowed for the system to develop in severity and form the tornado of interest. The satellite imagery below shows the blue and green-colored upper-level water vapor above southern Georgia, which is also a key factor in keeping storms sustained.

Figure 2: A satellite image from GOES-16 of upper-level water vapor across the US, taken at 14:10 Z on March 9th (10:10 AM EST). The darker grays signify drier air, while the lighter grays and warmer colors signify concentrations of water vapor. (Courtesy of CSU’s CIRA/RAMMB)
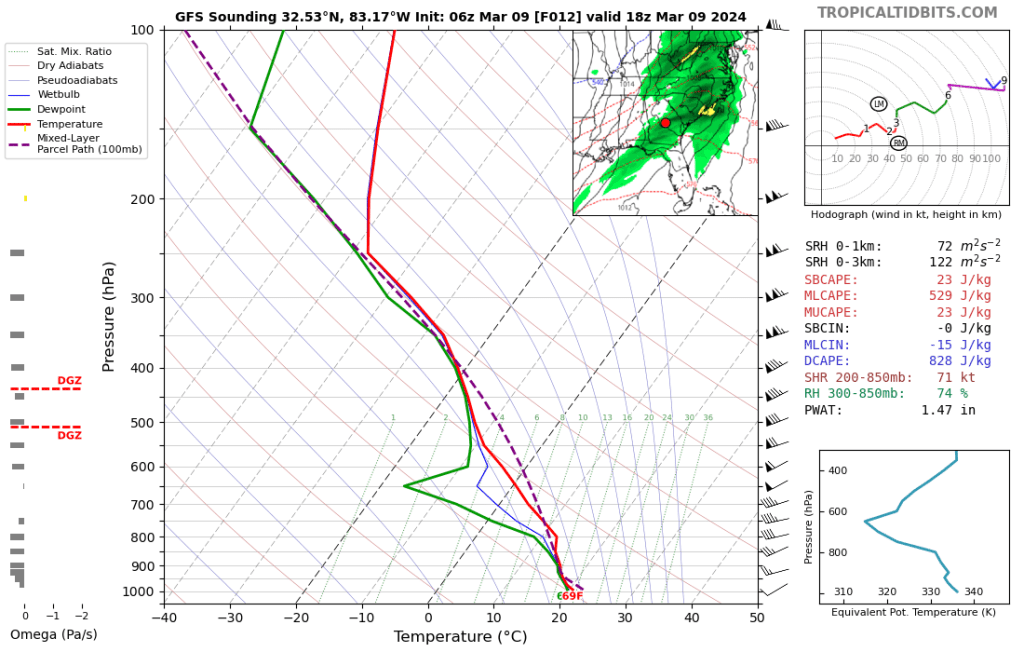
Figure 3: A computer-generated skew-T plot of the atmospheric conditions during the storm around Brantley County for 18 Z on March 9th (2 PM EST). These lines display how the area’s temperature and dew point change as altitude increases, their interactions leading to various outcomes such as precipitation in this case. (Courtesy of Tropical Tidbits)
As displayed above, the theoretical skew-T diagram for the general area showed a little bit of CAPE (convective available potential energy) from the conditions, though not a substantial enough amount to cause great concern. With this thermodynamic instability, any parcel of air heated at the surface is free to rise through the cooler upper atmosphere, sometimes with water vapor also rising and condensing rapidly in the process. With little inhibitive temperature inversion near the surface to keep them at bay, any air parcel that heats past the lower saturation would be able to rise freely through the mid-atmosphere, allowing for sustained convection. But without more favorable conditions, the thunderstorms remained more mild.

Figure 4: An image of the 250mb plane, also known as the jet level, at 18 Z for March 9th (1 PM EST). Jet streams form from temperature imbalances between general air masses, causing fast-flowing winds where they meet. The warmer colors signify increasing wind speed in knots and the black contours lines of constant pressure in mb. (Courtesy of Tropical Tidbits)
With lacking thermodynamic conditions, the dynamic side of the atmosphere certainly helped in boosting the storm’s severity. The 250mb plane, located just below the tropopause, above shows the beneficial positioning of the jet streams’ positions when the storms hit southern Georgia. These fast-flowing currents of wind follow the “push” and “pull” between air masses of different temperature moisture content, and help dynamically sustain or inhibit storm systems. With the low-pressure system of 999mb centered northeast of Lake Huron, its impressive scale came with a cold front that spanned far south, where meeting the warmer air to the east of the front allowed for thunderstorms to form. And with wind speeds of 120 knots or so above the area of interest, the faster winds in the upper atmosphere encourage air below to fill the quickly vacating area of air, causing convective, upward motion. And given the meeting of the two jet streams in the northern Mississippi to Georgia region, as shown by the bright purple, the wind currents could support this convective activity where the cold front passed through the southern states.

Figure 5: A composite image of various radar products during the tornado’s landfall, showcasing composite reflectivity, correlation coefficient, and rotation–all at 18:44 Z on March 9th (1:44 PM EST). For composite and correlation, the warmer colors signify increasing returned energy and decreasing target similarity respectively, and then cyan representing the fastest rotation rate for the rotation product. (Courtesy of MRMS)
When the tornado did eventually touch down, it wasn’t very obvious on the radar, where typical signs such as a distinct supercell shape, with a slight hook near the southwestern corner of a storm, in composite reflectivity nor a low correlation coefficient value, typically blue in color, of a debris ball were present. However, utilizing the rotation product, with the bright cyan showing rapid rotation, helps clarify the presence of the weekend twister.