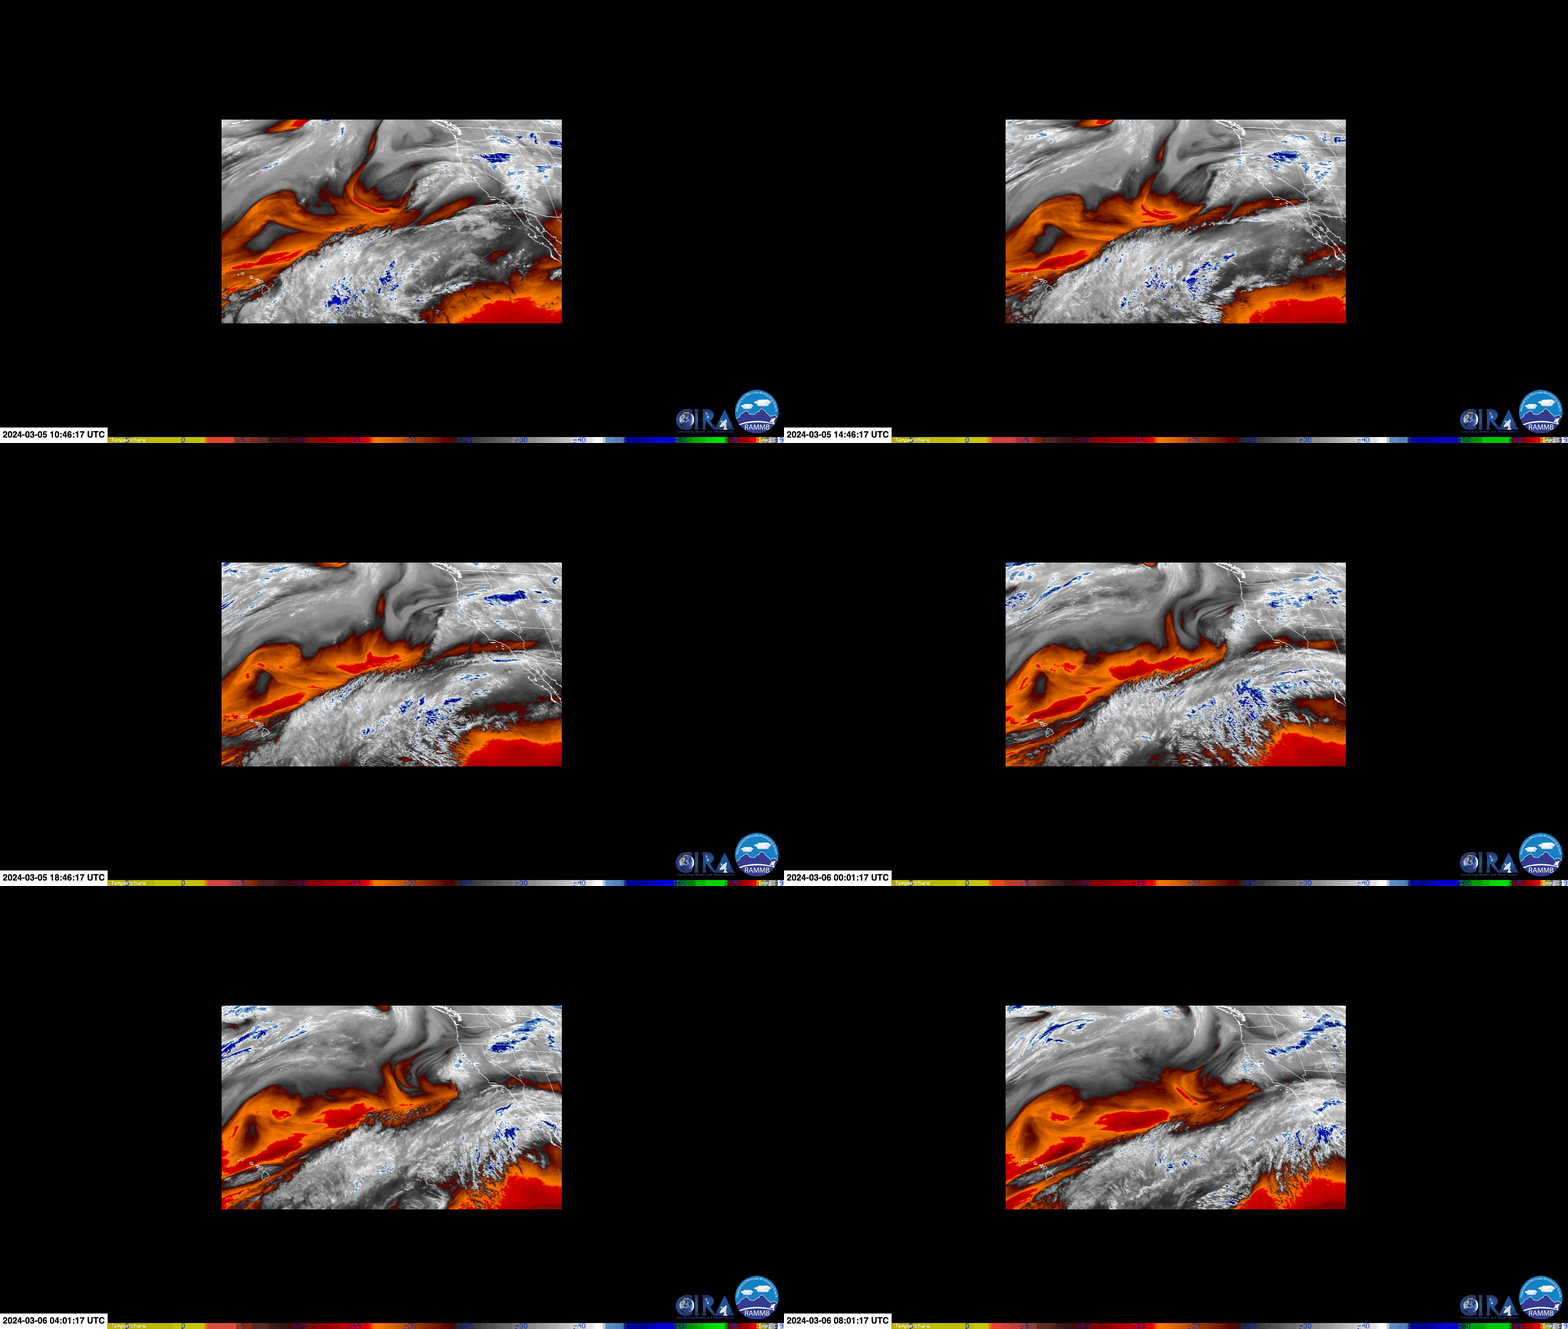
Rain showers impacted the Northern California residents of Crescent City for the entirety of March 5th and caused many WXChallenge participants to express their doubts about the forecasted two inches of precipitation. This precipitation was not fueled by an atmospheric river event as many California showers are, but instead by strong upper-level dynamics that created divergence aloft. The loop below is from the GOES-16 satellite specifically focused over the West Coast and the Pacific Ocean. The satellite shows the water vapor at mid-levels of the atmosphere, where the blue coloration indicates moisture and the red-orange coloration indicates dryness in the atmosphere. This loop is cycling from 3:00 am PST on March 5th to midnight on March 6th, this is the period that the most precipitation was recorded in Crescent City. There is significant dryness being transported over the Pacific, this dry atmosphere is following in line with the jet streak. There is a very small pocket of moisture that appears over the Crescent City area, but because there is no uniform moisture the moisture in the atmosphere is not the main driver of this precipitation event.

Figure 1: Mid-level Water Vapor satellite loop from the GOES-16 visible imager from 1100 UTC March 5, 2024 (3:00 am PST) to 0800 UTC March 6, 2024 (12:00 am PST). Imagery loop downloaded from Colorado State’s satellite imagery website: https://rammb-slider.cira.colostate.edu/?sat=goes-16
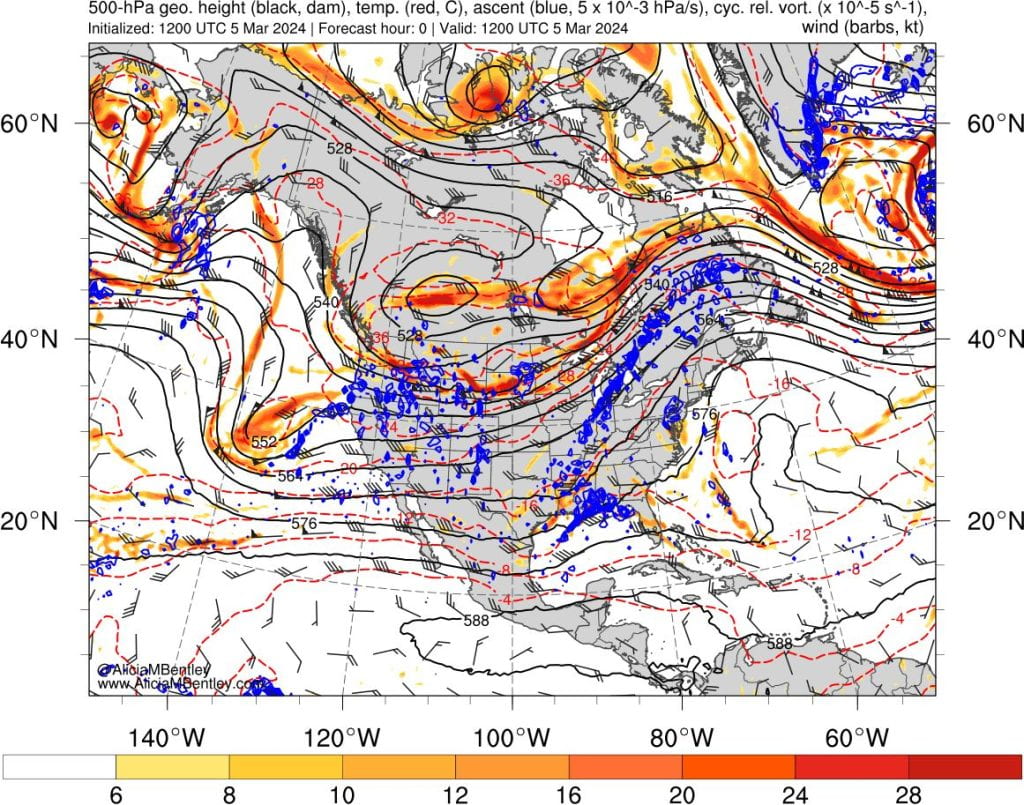
The atmospheric conditions in the upper levels are to be blamed for the longevity and strength of this event. Below are images courtesy of Alicia Bentley’s weather archive that depict the upper-level atmospheric conditions. On the left is a 500mb relative vorticity map. The warm coloration indicates this vorticity, the blue blobs show upward vertical motion at this layer, and the black, solid lines indicate the geopotential height. This map is from March 5 at 4:00 am PST, a few hours before the precipitation moved through Northern California. Looking at the Crescent City region, there are significant areas of blue coloring, indicating upward vertical motion at the 500mb level. On the right is a 300mb wind speed weather map. The coloration on the map shows the wind speeds, and from this, we can assume the location of the jet streak. The red blobs indicate upward vertical motion at this level. Because there is upward vertical motion depicted throughout the atmospheric layers, we can determine that there is divergence aloft. Divergence aloft is the key factor that created atmospheric instability that fueled this event.


Figures 2 & 3: Alicea Bentley Archive Weather maps from 1100 UTC March 5, 2024. Imagery downloaded from Albany State’s weather archive:
https://www.atmos.albany.edu/student/abentley/realtime/standard.php?domain=conus&variable=rel_vort
This storm did not have a favorable setup for growth to the chagrin of severe weather enthusiasts. In the image below there is a surface analysis and visible satellite image laid side-by-side. These images are from the same period, March 5 at 10:00 am PST, and will be useful to determine if this is an anafront or katafront. On the visible satellite image, there is a deformation zone, which is a region of strong stretching or shearing. We can see the deformation zone on satellite imagery, as it is where there is a harsh line of clouds. When comparing the deformation zone to the surface analysis location of the cold frontal boundary, we can see that the cold front is positioned well behind the deformation zone. This proves that the cold front is katafront. Katafronts are an indicator of a decaying cold front and are followed by rapid clearing and a gradual decrease in temperature. Both of these conditions are seen with this specific storm event. Though the upper-level atmospheric conditions were adequate to generate surface precipitation, the katafront and lack of atmospheric moisture did not allow this system to strengthen. Fortunately, Crescent City is not surprised by significant precipitation as it is common in this region of the United States and did not have any notable impacts on the region.


Figure 4: Surface Analysis of the Southeast United States at 1800 UTC (10:00 am PST) on March 5, 2024. Image accessed through the WPC Severe Weather Archive Page: https://www.wpc.ncep.noaa.gov/html/sfc-zoom.php
Figure 5: Upper-level 6.2 micron Visible satellite loop from the GOES-16 visible imager from 1800 UTC March 5, 2024 (10:00 am PST). Imagery loop downloaded from Colorado State’s satellite imagery website: https://rammb-slider.cira.colostate.edu/?sat=goes-16

