
The morning of Thursday, February 25, 2021 was relatively quiet across much of the continental United States, with one of the few areas of precipitation over the Pacific Northwest. This occurred due to a low-pressure system moving into western North America from the northern Pacific. The WPC surface analysis map from 12Z that morning shows the cyclone center over the Alaska panhandle with cold, warm, and occluded fronts extending to the south:
 Figure 1. WPC surface analysis, 12Z 25 February 2021.
One way to analyze storm systems like this is water vapor imagery, which measures brightness temperature at certain water vapor-specific wavelengths that are unaffected by other components of the atmosphere. Higher brightness temperatures (yellow-orange colors) indicate dry air, while lower brightness temperatures (blue-white-green colors) indicate moist air or clouds. On the map, the low-pressure system moving into North America is easily identified as the area of counterclockwise spin moving into the Alaska panhandle, with a large area of clouds to its east. The cold front can be seen as the sharp boundary extending south from the cyclone center, separating those clouds from much drier air just to the west.
 Figure 2: GOES-17 Mid-level Water Vapor, 0330-1045Z 25 February 2021.
Another feature of note is the stream of lower brightness temperatures, indicating higher water vapor content, extending from the central Pacific near Hawaii northeastward across the ocean into the low-pressure system. This is similar to an atmospheric river, although it may not meet the specific criteria to qualify as one. Either way, it shows that the cyclone moving into North America had plenty of moisture to work with, resulting in significant precipitation over this region. This precipitation can be identified using radar reflectivity:
 Figure 3: NEXRAD Reflectivity, 1103Z 25 February 2021.
Radar reflectivity is determined by the size and concentration of the raindrops or snowflakes. Although the product does not directly distinguish between rain and snow, the appearance of the reflectivity map can often be used to make a pretty good guess at precipitation type. Higher reflectivity values with sharper edges usually indicate rain, while snow has a much smoother appearance with lower reflectivity values. On the map above, most of the precipitation west of the Cascades in western Washington is probably rain, while snow is likely falling in eastern portions of the state. This can be verified with surface observations, which showed rain in most locations west of the mountains with temperatures well above freezing (high 30s-low 40s). In contrast, many sites in and east of the mountains reported snow with temperatures in the high 20s to low 30s.
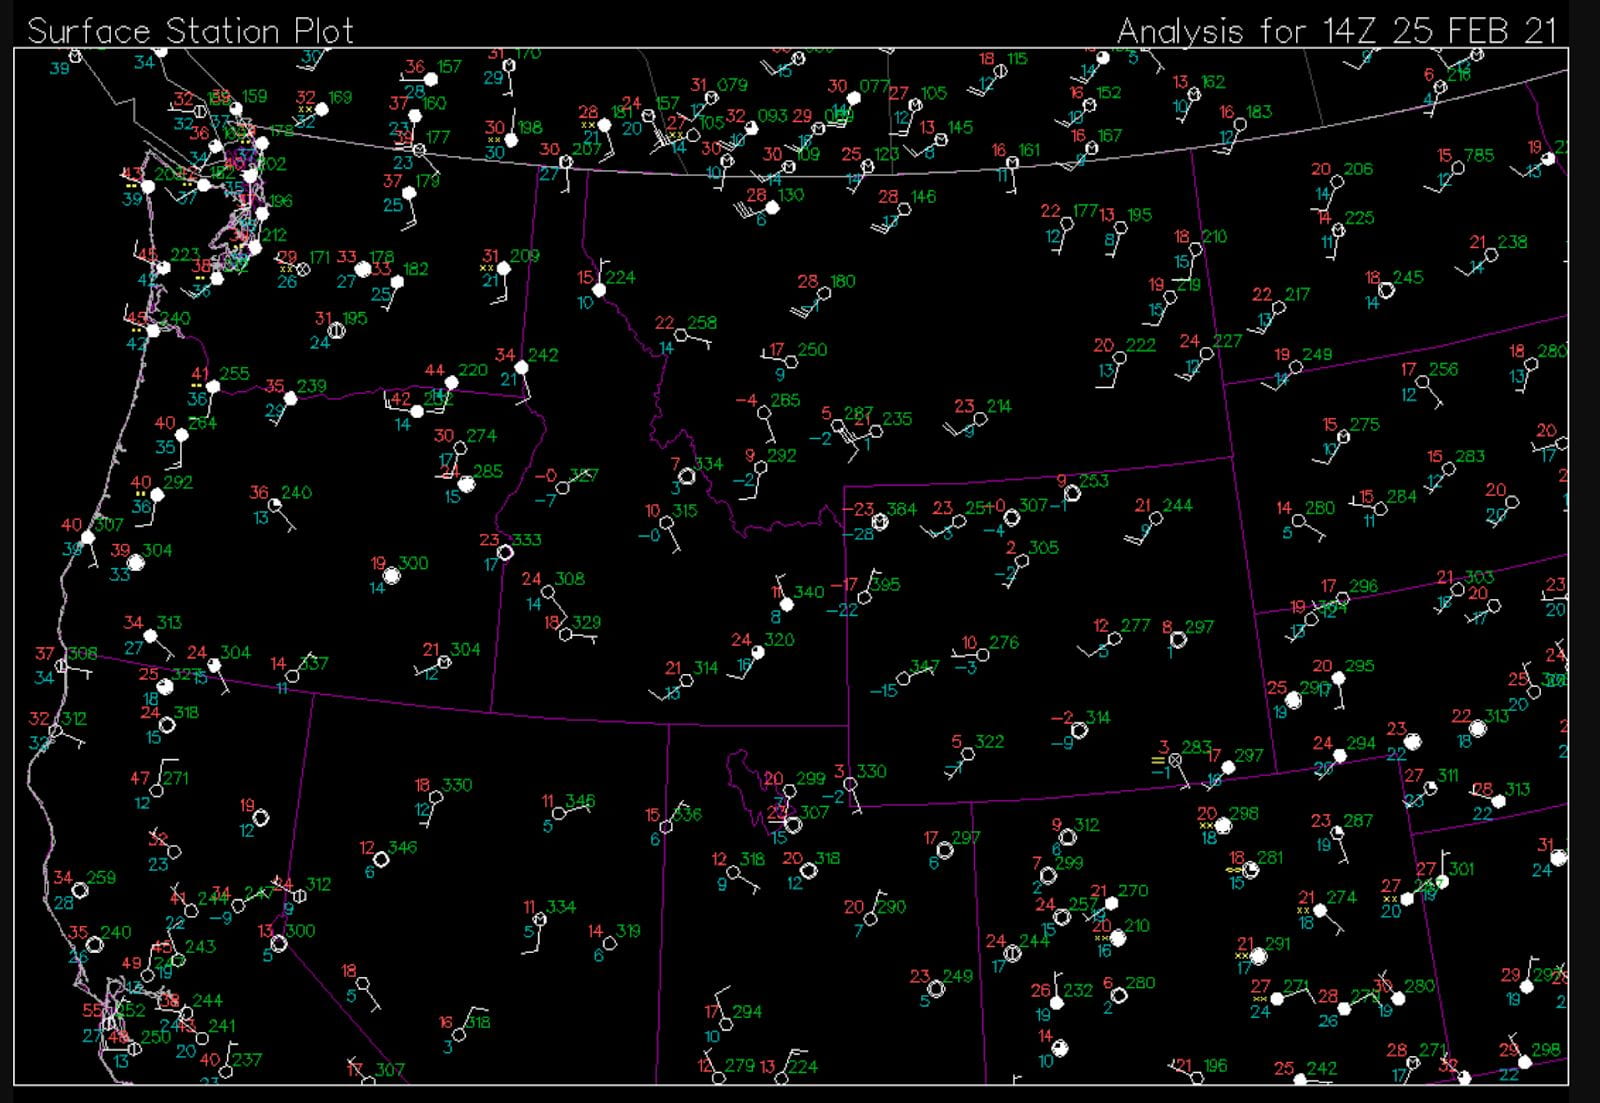 Figure 4: Surface Station Plots (University of Wisconsin), 14Z 25 February 2021.
Ultimately, the storm dropped upwards of a foot of snow in many mountain areas, with several lower elevation areas also seeing at least a few inches. The storm continued to move eastward over the course of the next day, with winter storm warnings and advisories issued as far southeast as Wyoming and Utah.