The January 28th to 29th Winter Storm and its Effects (author: Blake Berge)

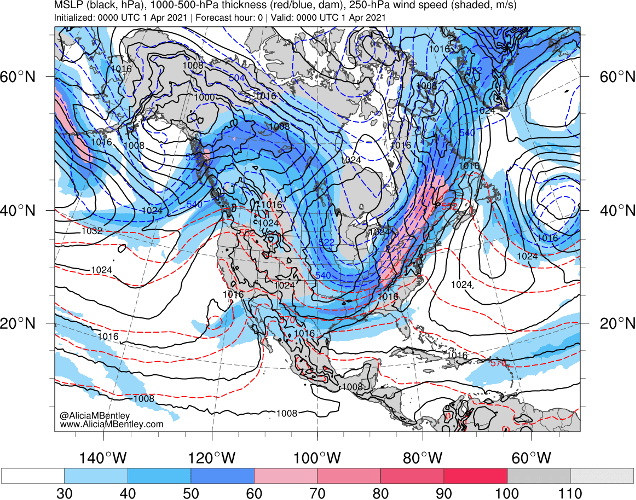
On January 29th Boston, MA saw nearly two feet of snow in a day, nearly breaking an all-time daily record of 23.6”. This storm is not unusual, however, as it took the shape of the classical nor’easter. A nor’easter is a strong storm system that sweeps up the coast of the eastern U.S, typically resulting in a severe or winter storm threat. These storms gather energy by pulling in moisture from the relatively warm waters of the western Atlantic, driving it in an anticlockwise direction. With the combination of moving up the coast and this circulation, nor’easters can create dangerous or life-threatening situations for people along the northeastern U.S. coastline. One interesting aspect of this storm was the negatively tilted trough, or elongated regions of low pressure, seen hovering over North Carolina and Virginia on the morning of the 29th:

Figure 1. 500 Millibar Analysis Map of the Contiguous U.S. at 7 a.m. EST on Jan. 29th.


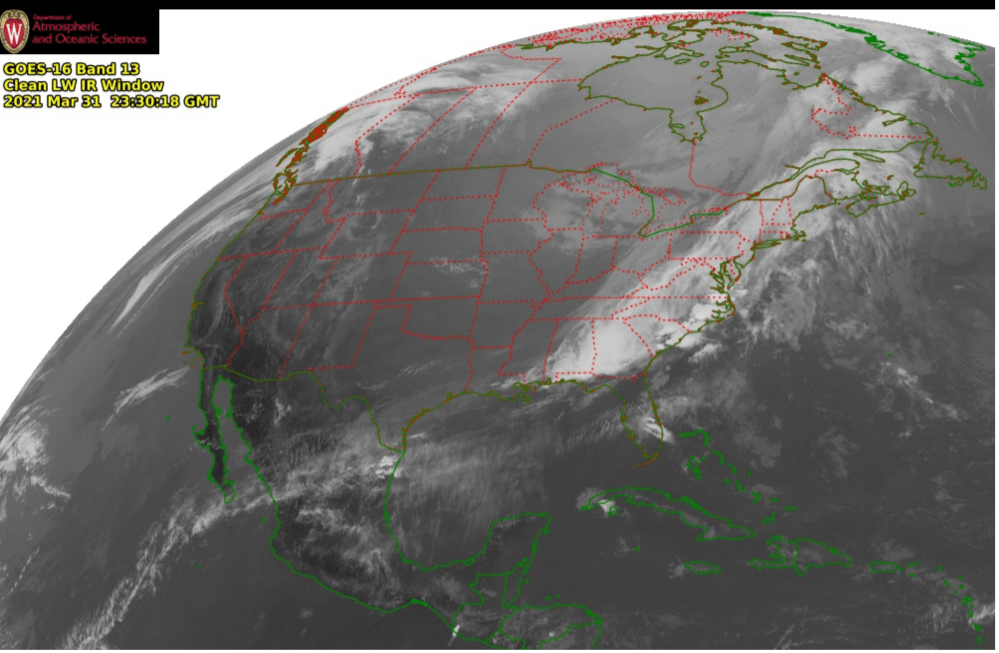
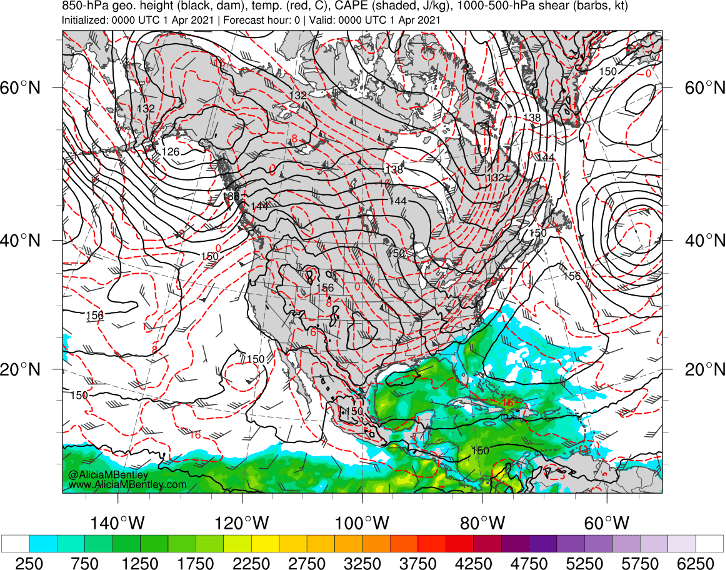
This trough assists in the main storm system further to the east by allowing for stronger convergence at the surface low. This is because to the east of troughs there is stronger divergence in the upper level, allowing for more air to converge at the surface, strengthening the storm. Additionally, this trough was negatively tilted, which means the trough axis was along a northwest to southeast line. This indicates the storm was strengthening or was near maturity at this point, as the excess movement in the trough at this stage may cause it to dissipate as it becomes more tilted. Moving down through the atmosphere to the surface, the map below shows a combination of satellite infrared imagery with a surface analysis map:

Figure 2. Surface analysis and infrared satellite view of the nor’easter early on the 29th.


The surface low can clearly be seen off the coast of North Carolina in this map. The color scheme indicates the temperature of the object, as seen from a satellite; the redder the object, the cooler it is. This temperature can be useful for determining the strength of some storm systems, and here it is evident that the nor’easter is involved with the large region of cooler clouds. The large swath of clouds and cool cloud tops over New England indicates unsettled weather in these regions. Moving to the southeast, the cold front passing over Georgia and Alabama brought along with it some backside moisture, creating light to moderate snow showers as seen in the radar loop below:

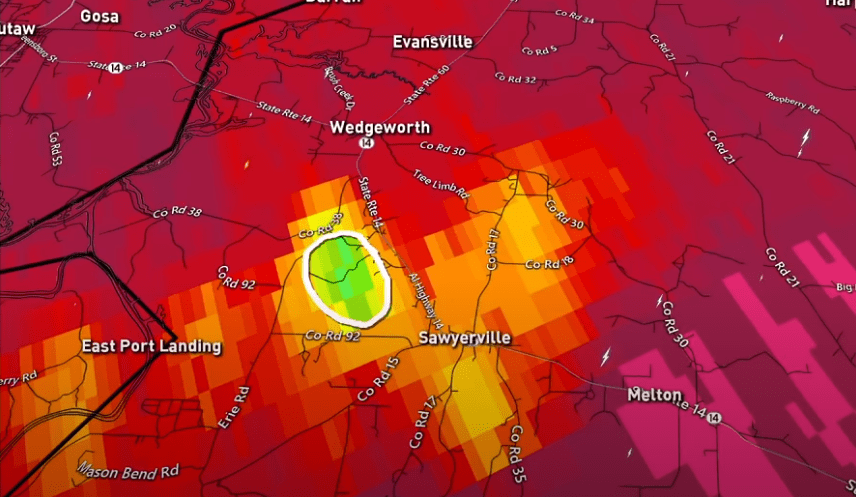
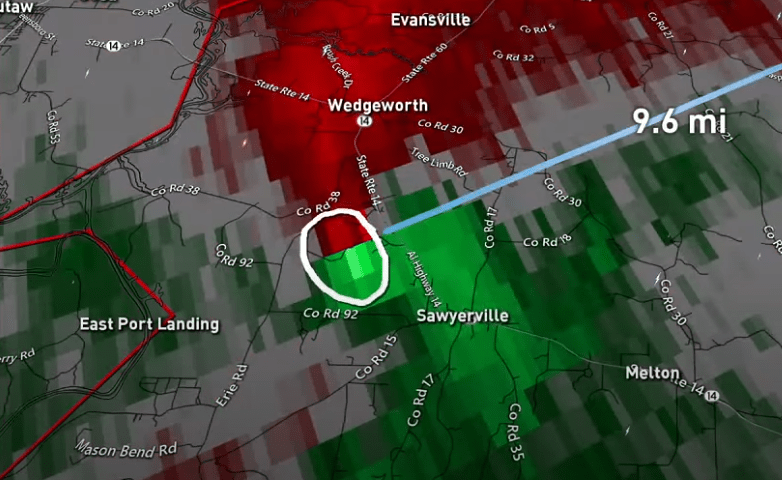
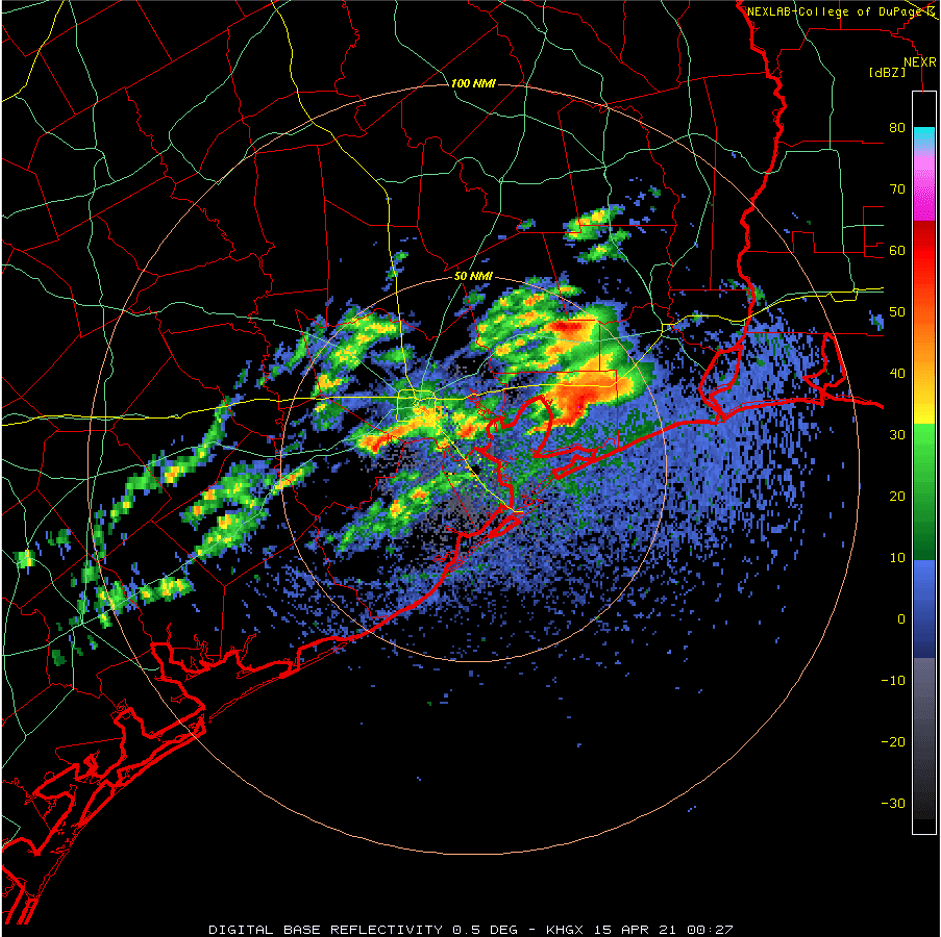
Figure 3. Radar loop of light and moderate snow over the south around midnight on the 29th.


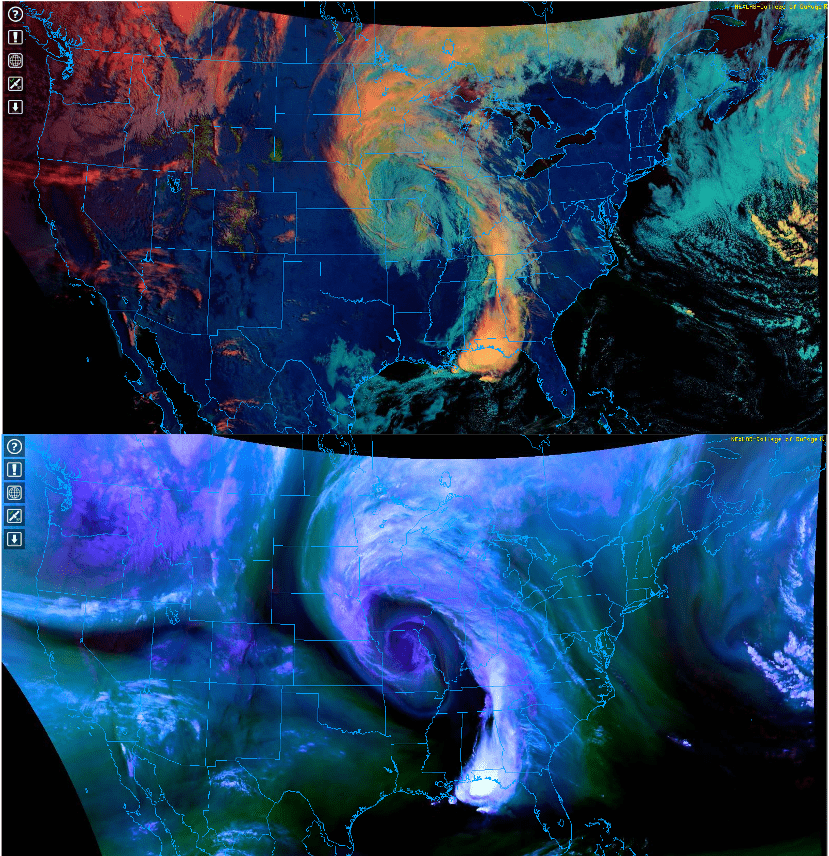
Here, the path of the snow is northwest to southeast, identical to the direction of the cold front. These quick 15–30-minute snow showers brough totals of almost one inch in some places, resembling snow squalls typically seen farther north. This isn’t too surprising considering the modest radar reflectivity seen above, which corresponds to precipitation intensity. Additionally, the snow totals were enough to see using satellite imagery. For example, the specialized red, green, and blue (RGB) imagery called the “day cloud phase” from GOES-16 can pick up the small amount of snow cover. Overall, this event brought wintry weather to much of the eastern U.S., with a surprise snowfall closer to home in the southeast.

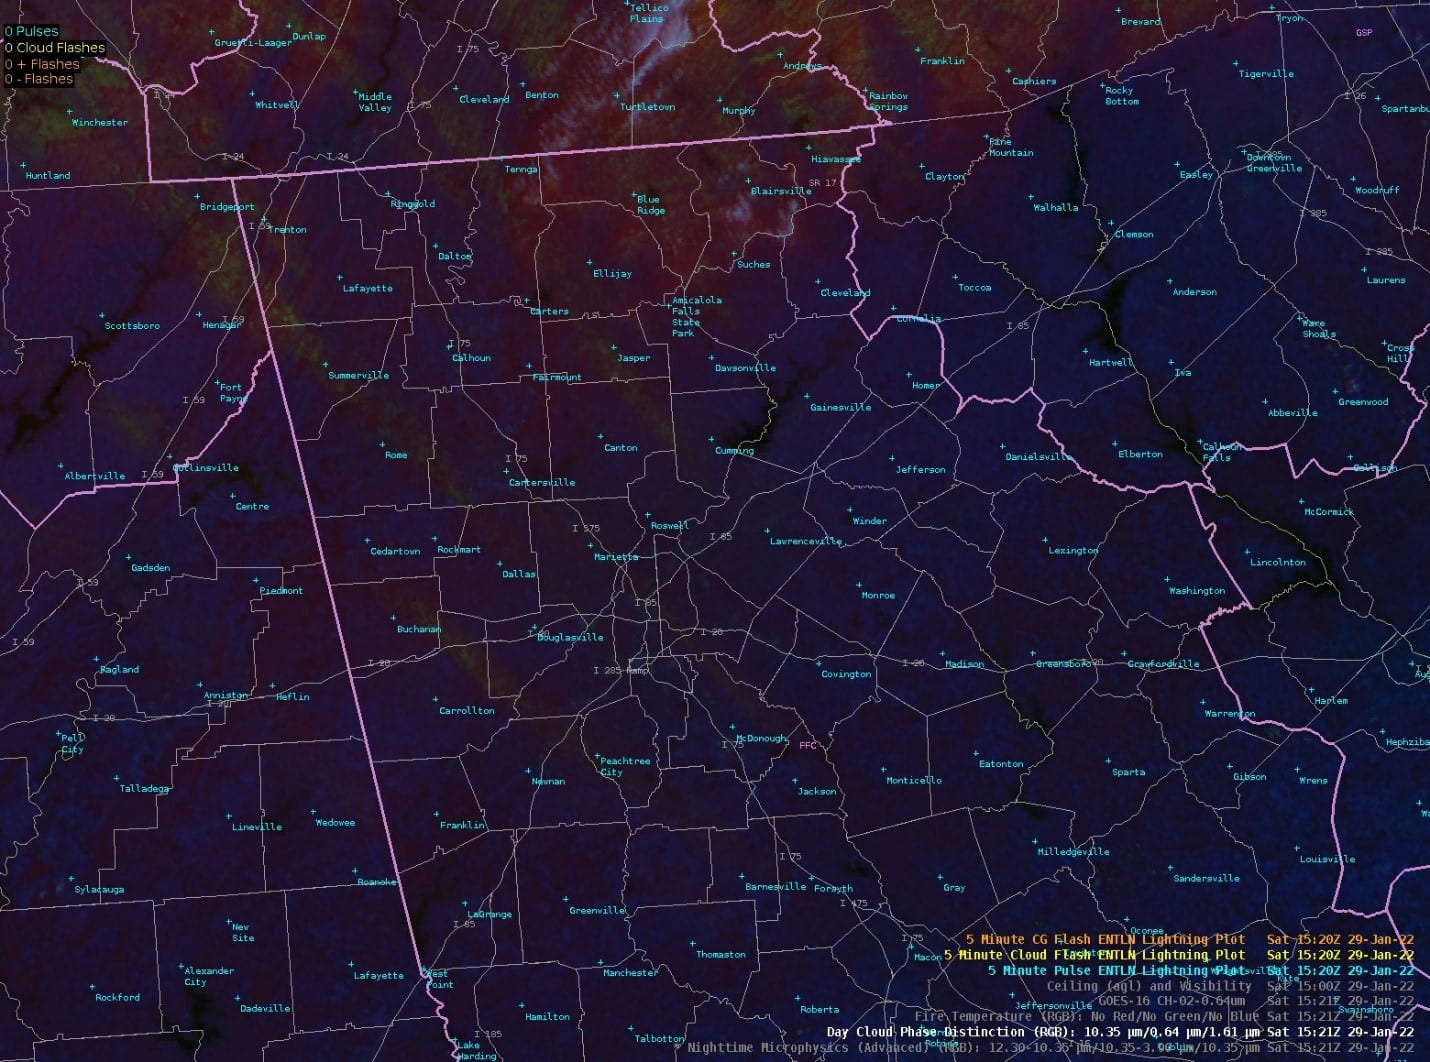
Figure 4. Snowfall seen in this RGB satellite product is represented as green streaks over northern Georgia and Alabama.

Hurricane Ida Chase Report (author: Kevin Lu)

Hurricane Ida was a category 4 major hurricane that made landfall in Louisiana on the 29th of August 2021 with 1-minute sustained winds of 150 mph. The author rode out the storm in Morgan City at 29.700N 91.199W. The sea level of the location was approximately 5 feet. Ida’s center passed approximately 35 miles east of Morgan City around 4 PM CDT. The author collected meteorological data with the WeatherFlow Windmeter on a rotating mount and surveyed the damage of regions hit by the eyewall.

Ida had a distinct concentric eyewall feature shown on the radar. Concentric eyewalls are characterized as a double eyewall structure with a dry slot known as the “moat” separating the inner and outer eyewall. The inner eyewall is generally where the strongest winds occur because a narrower eyewall tends to have a steeper pressure gradient. Hurricane Ida maintained a concentric eyewall structure for approximately 6 hours after landfall before a widening of the inner eyewall was observed. Cities such as Houma and Raceland took a direct hit from the inner core.

Radar image of Hurricane IDA at 16:20 pm CDT 29 August— mesovortices likely explain the jagged edges of the eye. (Image: https://weather.us/radar-us/terrebonne/reflectivity/KLIX_20210829-212621z.html)

Morgan City was located on the dry westward side of the storm and did not receive any hurricane-force winds. Conditions started to deteriorate at approximately noon. Morgan City lost power around 2 PM and lost communication around 7 PM. Peak conditions at Morgan City occurred at approximately 3 PM. The author’s device recorded peak sustained winds of 12m/s gusting to 26m/s and minimum air pressure of 992 mbr. Hurricane chaser Josh Morgerman, who was in Houma, recorded pressure of 964 mbr with a Kestrel 4500.

Figure: Air pressure data from Josh Morgerman at Houma

There was no damage in Morgan City except for fallen tree branches. Storm surge did not reach the city despite the low elevation. Widespread catastrophic wind damage was observed between Houma and New Orleans. The author consistently observed torn roofs, shredded gas stations, downed powerlines, and tree trunks snapped in half in those heavily hit areas. The worst wind damage occurred in areas where the front right quadrant of the eyewall passed over. Raceland in particular had entire forests snapped in half and houses that were missing interior walls. New Orleans had wind damage comparable to Houma despite its much further proximity from the center. This is likely due to the movement of the storm contributing to the right front quadrant winds. Louis Armstrong International airport was closed for several days due to heavy damage. The author was able to fly out of Louisiana from cities west of Morgan City that weren’t heavily impacted by the Hurricane.

Source: Kevin Lu

Analysis of the Advancement of a Tornado Producing Squall Line on Feb 3rd in Western Alabama (author: Madison Richardson)

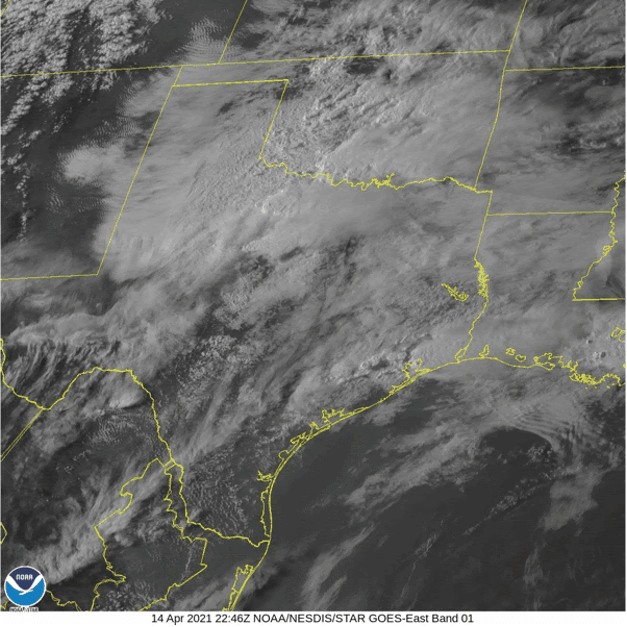
GOES 16 Band 9 (Mid-Level Water Vapor)

On February 3rd 2022, a line of severe storms moved across Mississippi into western Alabama. The storm spawned 5 tornadoes total, with two being EF-2 category twisters. This was notable as it occurred during the winter months instead of during the spring like expected. Above is a time loop of the water vapor images taken of the storm from 7am February 2nd through 7am February 4th. This figure does a wonderful job of depicting the warm, moist air advection from the Gulf of Mexico ahead of the front with dry, cooler air following directly behind it. The moisture from the Gulf helped fuel this storm as it progressed eastward.

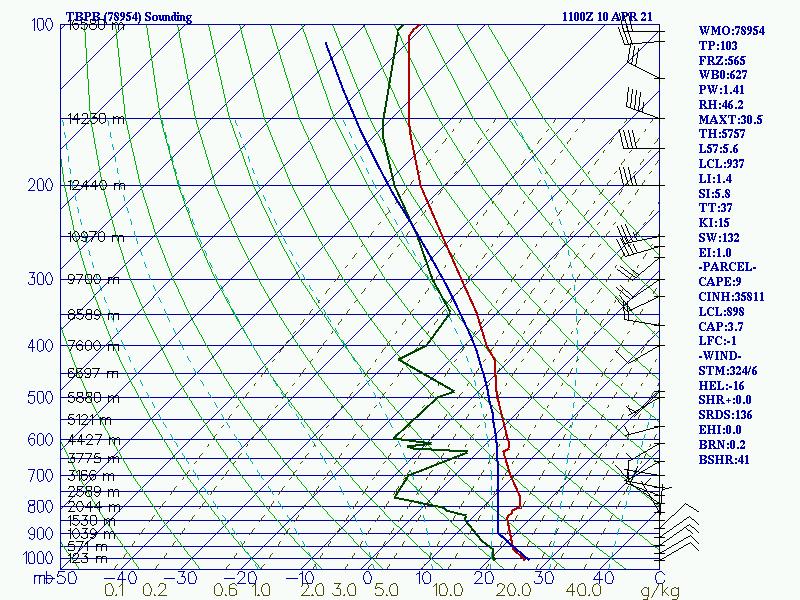
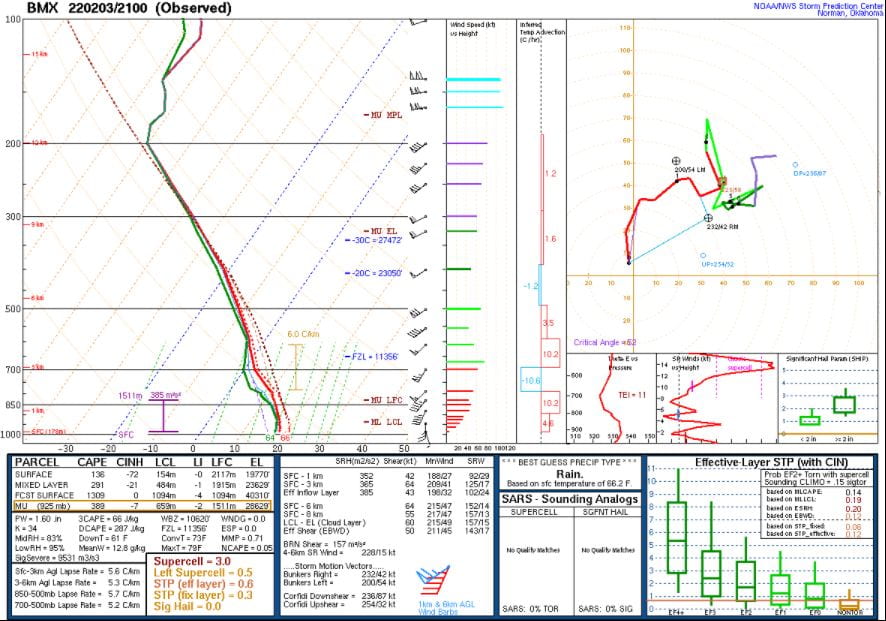
Sounding via NOAA/NWS from 3pm CST 3 February 2022

The following sounding measurements were taken via weather balloon at 3pm CST, approximately an hour after the most robust tornado touched down in Forkland, AL and stayed grounded for approximately 26 miles until it arrived in Sawyerville, AL. The solid red line on the right side of the sounding represents the vertical temperature profile while the solid green line on the left side represents the vertical profile for dew point. The temperature/dew point values are plotted on an angled axis seen on the horizontal axis at the bottom of the graph. The more rightward the line on the graph, the higher the value. As can clearly be seen, the dew point line and temperature line are very close, displaying that the air is highly saturated if not fully saturated at some altitudes (when the lines overlap). The warmer air with more moisture near the surface serves to increase instability, because this air has a tendency to rise upward, which is a key component for setting the scene for tornadic activity.

In order to accurately monitor the formation and duration of the tornadoes on this day, meteorologists relied heavily upon dual-polarization (dual-pol) radar stations surrounding the region in western Alabama and east Mississippi. Dual-pol radar provides better estimates of the shape and size of targets the radar picks up on by sending out both horizontal and vertically oriented pulses. Part of the dual-pol upgrade to the existing WSR-88D stations included the newfound ability to measure the correlation coefficient (CC) between the sizes of target objects. This essentially measures the uniformity of the targets measured so rain would have a very high CC while a non-weather related target like a flock of birds or insects would have a considerably lower CC. When trying to determine where a tornado has touched down, it is useful to look for where the CC drops drastically as this often is indicative of debris being uplifted by the tornado. This is known as a ‘debris ball’ and one can spot it on a CC radar image by looking for sharp drops in CC in a concentrated area surrounded by more uniform targets with a high CC (rain, etc.). In the image below, the debris ball is the green portion of the CC image amidst much higher (red) CC values.

Correlation coefficient map indicating ‘debris ball’ from Forkland-Sawyerville EF-2 tornado

Tornadoes are made even more apparent to meteorologists when looking at base velocity maps. These maps color code where wind is moving away from the radar station and where it is moving towards it. The direction can only be measured in relation to the direction of the beam so what is plotted is always an underestimate of the actual wind speeds as it only captures a component of the wind velocity. The green colored areas show where the wind is moving towards the station while red indicates it is moving away from the station. Below is the base velocity map from the exact same time as the correlation coefficient map above. They both have circles around the area indicative of a tornado on the ground. In the base velocity map, a coupling between red and green with a high brightness, meaning that the reflectivity is higher, means there is significant circulation in that area.

Though the tornado was detected and monitored in this way for the duration of the storm, it was difficult to pinpoint its exact location as this area of Alabama is far enough removed from surrounding radar stations that the beams monitoring the area are abnormally high. This is the case because beams are sent out in straight lines angled upward while the Earth is curved so as the beam covers more horizontal distance, it only ‘sees’ what is happening higher and higher in the atmosphere. This means that detected activity closer to the surface is more difficult to measure and it could be that the tornado showing up on radar is actually closer to the station than anticipated because the beam is measuring what is happening at a higher altitude.

Satellite Analysis of Feb 3rd Alabama Tornado Producing Storms (author: Coley Chapman)

On February 3rd, 2022 a large thunderstorm originating in Mississippi crossed into west Alabama. During the storm, 3 EF-2 tornadoes touched down within an hour and a half, and later two EF-0 tornadoes touched down. The most destructive and largest of the 5 was the Forkland- Sawyerville Tornado, touching down at 1:38. It caused 8 injuries and unfortunately 1 fatality.

The storm that caused the tornado can be seen in the following surface analysis map from the national weather service. This surface analysis map shows the temperature in red numbers and then the dew point in green numbers, and the closer the two the more humid the air is. In this surface analysis map taken at 12 pm, we can see a warm air mass coming up from the Gulf of Mexico and meeting a much cooler air mass on land. This meeting creates a cold front (lined in blue on the map) that can be a catalyst for intense thunderstorms.

Beyond just surface analysis maps, we can also see this same moist air mass coming up from the Gulf of Mexico in a water vapor image from GOES-16. GOES-16 is a geostationary satellite that is constantly pointed at the eastern United States. It has an imager that is capable of isolating different wavelengths, or bands, of information. Band 10, shown below, corresponds to the IR energy emitted from low-level water vapor. As the image gets brighter, it corresponds with more humid air.

Another notable feature of the GOES-16 Satellite is the ability to zoom in on a small section of the viewable area and acquire data that is both higher resolution and faster to update. GOES-16 Features two of these Mesoscale Imagers, and during the Alabama tornadoes on February 3rd, both were used to track the storm with new images coming in every minute. In the image below, I have superimposed the two images on top of each other to show the entire viewable area at the time the largest tornado touched down. This technology showcases the ability of satellites to help people in need on the ground with real-time updates.

Doubling Up on the Relatively Less Severe (author: Jackson Sims)

Fig. 1. WPC surface analysis maps valid at 21Z 7 April 2021 (left) and 06Z 8 April 2021 (right) showing frontal boundaries, high and low pressure centers (blue H’s, red L’s, respectively), sea level pressure (contours, hPa), and surface station plots over the eastern United States, and NEXRAD radar reflectivity mosaic from 15Z-23Z 7 April 2021 [1, 2].


Wednesday evening into Thursday morning, a double-low extratropical cyclone feature was centered over the central U.S. with cold frontal boundaries extending from southern Minnesota to eastern Texas. As indicated above in surface analysis maps, the double-low eventually merged into a single deeper low (coming in at 996 mb at 06Z 8 April 2021) and also forming with it a double cold frontal boundary extending to the south of the low pressure center now located in central Iowa. By 03Z 8 April 2021, the precipitation and convective activity associated with this extratropical cyclone and accompanying frontal boundaries encouraged the issuance of a handful of severe thunderstorm warnings across the storm chasing region of the central U.S. and a tornado warning in the vicinity of Shreveport, Louisiana. Radar imagery shows core and gap structures in the rainbands as well indicating horizontal wind shear present. Wind shear and forcing from frontal boundaries propagating through the region fired up some intense convective activity and precipitation observed in multiple cold frontal rainbands extending from the low pressure center to the Gulf Coast.


Fig. 2. “Natural” Color, Channel 13 Infrared, Day Cloud Phase RGB, Airmass RGB, and Upper Level Water Vapor GOES satellite imagery over the continental U.S. valid at approximately 2030 UTC 7 April 2021 [2, 3].


Satellite imagery shows a clear Comma-head structure to the north of tailing rainbands to the south with the center of the low circulating in the vicinity of the Iowa-Nebraska border. “Natural” Color imagery gives an indication of where frozen precipitation may be occurring in the “comma-head” region where colder air is usually located with extratropical cyclones as well as where intense convection is located (along the frontal boundary to the south) through cyan coloring of frozen cloud particles. In IR imagery, we observe intense cold brightness temperatures associated with the higher cloud tops and intense convection along the cold frontal boundaries. In the Day Cloud Phase RGB imagery, the yellowish colors indicated thick cloud structures with frozen particles at high altitudes associated with intense convection along the cold front front, while bluish colors indicated liquid droplets in clouds at low altitudes. The Airmass RGB imagery gives us an indication of where anomalously high potential vorticity (PV) is located via red-orange colors. Thus, it is an indication of where the jet stream is located (observed ridging over the rockies, slightly dipping south just upstream of the extratropical cyclone, and ridging again over the eastern U.S.) as well as potential intrusions of stratospheric air into the upper troposphere (observed just to the south-southeast of the low pressure center). Airmass RGB also gives an indication of the contrast in air masses at play with this extratropical cyclone via greens indicating warm moist air and blues indicating colder drier air. Upper Level Water Vapor imagery also shows the jet stream and a dry air intrusion being ingested into the extratropical cyclone at this time, indicating the likelihood of cyclogenesis (strengthening of the cyclone).


Fig. 3. Dual-pol WSR-88D imagery from Duluth, Minnesota from approximately 2230Z 7 April 2021 – 0030Z 8 April 2021. Top panel shows base reflectivity, the second panel shows differential reflectivity, the third panel shows base velocity, and the fourth panel shows correlation coefficient [2].


Radar imagery from within the comma head region on the northern edge of the extratropical cyclone shows some of your typical more stratiform precipitation for this area in base reflectivity above in Figure 3. The expected base velocity is also observed via radar data. Since Duluth, Minnesota is to the north of the center of cyclonic circulation, the flow field in the vicinity of the radar is expected and observed to be easterly and is shown above as green regions are motion towards the radar and red is motion away. There is also something else going on above called the “bright band” effect, which is where dual-pol radar indicates where the melting layer is. Base reflectivity seems to show a transition from liquid to frozen precipitation as well defined blobs of heavier precipitation give way to lesser intensity, smoother regions of indicated precipitation. Differential reflectivity subtly shows a band of noisy data in a similar region to where the precipitation type changes to the north and northeast of the radar site. Correlation coefficient on the other hand shows a much more distinct region of noisy data where it drops in the same band looking area. The band that is shown in the various radar data is indicative of the melting layer, which is where mixed precipitation is expected and the differential reflectivity and correlation coefficient readings become noisy due to the different types (and therefore shapes and sizes) of precipitation that are present at that level. When looking at surface temperatures and surface observations however, only liquid precipitation was observed and temperatures were above freezing. A quick look at a skew-t showed that temperatures were above freezing up to around 750 mb, giving any frozen precip at higher altitudes time to melt as it fell to the surface.


Fig. 4. Top left panel shows 250 mb wind speed (fill, kt), streamlines, and mean sea level pressure extrema (red L’s, blue H’s, mb). Top right panel shows 850 mb temperature (contours, °C), temperature advection (shaded, K/hr), frontogenesis (purple contours, K/100 km/3 hr), and wind barbs. Bottom left panel shows mixed layer CAPE (shaded, J/kg), 10m/850 mb/500 mb wind barbs (white, green, yellow barbs, kt), and mean sea level pressure (contours, hPa). The bottom right panel shows a vertical cross section of potential vorticity (shaded, 2 PVU dashed contour), wind out of page (purple contours, kt), and potential temperature (contours, K). All data show from 18Z 7 April 2021 over the continental U.S. [4].


Other analysis tools shown in Figure 4 give an idea of what could be expected from the extratropical cyclone overnight and the conditions contributing to the weather that occurred. The surface low is shown to be in between an upstream shortwave trough and downstream ridge in upper level flow, and is thus in a region of ageostrophic divergence which can contribute to upward vertical motions and strengthen the cyclone. The temperature advection and frontogenesis present in association with the cold front indicates that the front will likely strengthen and contribute as a forcing mechanism driving convection in the region. Also present in the region is some significant mixed layer CAPE and some decent vertical wind shear, which contributed to the intense convective activity present along the cold frontal boundaries throughout the Southeast. In an attempt to see if any upper level fronts were playing a role in the double cold frontal rainband feature observed in radar reflectivity, the cross section in Figure 4 was taken to see if higher PVU was intruding into the upper troposphere. The telltale dip in 2 PVU altitude near the jet stream is observed with the wind max being right where this slope is steepest, but there doesn’t seem to be a significant intrusion. Therefore, it seems that the double low that merged influenced the propagation of a double cold frontal boundary that provided forcing for the convective activity observed. This extratropical cyclone ended up producing 7 preliminary tornado reports, 59 preliminary wind reports, and 7 preliminary hail reports on 7 April 2021 across the central United States [5].

Sources:
[1]https://www.wpc.ncep.noaa.gov/html/sfc-zoom.php
[2]https://weather.cod.edu/satrad/
[3]https://www.tropicaltidbits.com/sat/satlooper.php?region=us&product=ir
[4]https://www.tropicaltidbits.com/analysis/models/?model=gfs&region=us&pkg=uv250&runtime=2021040718&fh=0
[5]https://www.spc.noaa.gov/climo/reports/210407_rpts.html

The Awakening of the La Soufriere Volcano (author: Dorien Minor)

Figure 1: GOES-16 True Color RGB on 9 April 2021 from 1230 UTC to 2130 UTC, in 10 minute intervals. Source: University of Wisconsin-Madison Space Science and Engineering Center (SSEC).


For the first time since 1979, the La Soufriere volcano in the eastern Caribbean has erupted, sending large plumes of volcanic ash and dust eastward into the Atlantic Ocean. According to seismic research conducted by the University of the West Indies, this active stratovolcano in the island country of Saint Vincent and the Grenadines has only had five explosive eruptions since 1718. Although a series of smaller eruptions began in December 2020, the most recent explosive eruptions began on 9 April 2021, and continued through at least 13 April 2021.


Figure 2: GOES-16 Ash RGB on 10 April 2021 from 1045 UTC to 1415 UTC, in five minute intervals. Source: University of Wisconsin-Madison Space Science and Engineering Center (SSEC).


Through many recent advances in satellite detection, GOES-16 satellites are able to use multiple frequency bands through various forms of RGB (red, green, blue) imagery to detect key meteorological and geological features, including volcanoes. Since volcanoes are capable of producing ash and sulfur dioxide gas that can be hazardous to public health and aviation, the GOES-16 Ash RGB product can be useful for understanding where such plumes are headed. Figure 2 shows the Ash RGB loop on the morning of 10 April 2021, which features frequent explosive eruptions from La Soufriere. At higher altitudes, the brown color represents high, thick ice clouds, whereas the tans and dark yellows indicate ash mixed with sulfur dioxide. Likewise, pure ash is shown in red and magenta, and is often at lower altitudes than the volcanic plume as it settles onto the surface beneath.


Figure 3: Absorbing Aerosol Index (AAI) measured by GOME-2 onboard the MetOp (Meteorological Operational) satellites from 9-13 April 2021. Source: EUMETSAT Satellite Application Facility on Atmospheric Composition (AC SAF).


Through the frequent and dense volcanic emissions between 9-13 April 2021, high concentrations of ash and sulfur dioxide were present in several islands that neighbored Saint Vincent, to include Saint Lucia to its north, the Grenadines and Grenada to its south, and Barbados to its east. Figure 3 provides another vantage point of volcanic emissions by looking at the aerosol absorbing index (AAI) measured by the European-based EUMETSAT organization, which is a measure of the absorption of ultraviolet (UV) radiation by “active” particles in the UV spectral range. As consistent with the previous satellite products, the largest initial explosions occurred on 9-10 April 2021, and is indicated by greater values of AAI above, as volcanic clouds deflect solar radiation back into space or the upper levels of the atmosphere. Barbados, which is downstream of the plume on 10 April 2021, issued a severe volcanic ash warning and temporarily closed their international airport in response to the high concentrations of ash and sulfur dioxide that were transported eastward. In the sounding below (Fig. 4), westerly winds at higher altitudes confirmed the motion of the volcanic plume as it reached the upper troposphere, and continued to serve as the dominant motion of ash and sulfur dioxide through at least 13 April 2021.


Figure 4: Sounding from Grantley Adams International Airport (TBPB) in Barbados on 10 April 2021. Wind barbs (in knots) are shown in black on the right edge of the sounding.

Texas/Louisiana Convective Event (author: Hannah Levy)

At first glance, the weather across the United States appeared quiet on 14 April 2021. However, a blip over southern Texas and Louisiana caught my eye. A few convective storms seemingly appeared out of nowhere. Figure 1 shows visible satellite imagery of this event. The storms bubble up rapidly around 2200 UTC 14 April 2021, with the peak convective activity located just east of Houston, Texas. Storms suddenly taking shape like this is often a signature of the influences of diurnal heating. This lines up well with the timeline of these storms, as they took shape right around sunset. The intensity of the storms is evident by the overshooting cloud tops seen on this visible satellite imagery. The overshooting cloud tops are a result of rapid upward vertical motions that cause the clouds to extend into the lower stratosphere. A severe thunderstorm warning was issued by the National Weather Service in association with these storms, further verifying what is seen on visible satellite imagery.


Figure 1 Visible satellite imagery from GOES-East, valid beginning 2200 UTC 14 April 2021 (5pm local time). The cloud cover is shown in the white/light grey, depending upon the thickness of the cloud cover. Land can be seen through the clouds in dark grey.


Investigation of water vapor imagery can allow for analysis of the moisture available with this rapidly developing system. Figure 2 shows the GOES upper-level water vapor imagery beginning around 2200 UTC 14 April 2021 (5pm local time). Water vapor imagery can show locations of the jet stream and jet streaks, and we can deduce some synoptic-scale influences from this. The jet stream is located on water vapor imagery by locating regions of brightness gradient of the white coloration. In Figure 2, the jet stream is located south of Florida, with increasing intensity off the coast. The high level of moisture in the vicinity of the convective cells is evident by the green coloration over eastern Texas and southern Louisiana. This indicates that plenty of moisture was present to fuel the rainfall in association with these cells. The location of the jet stream is removed from the direct vicinity of the convective activity, but there might be some influences from upward vertical motions associated with the right jet entrance region as this jet streak moves toward the Gulf coast of Florida.


Figure 2 Upper-level water vapor imagery, valid beginning 2200 UTC 14 April (5 pm local time). Moist airmasses (with high water vapor concentration) appear in the shades of green. Dry airmasses (with low water vapor concentration) appear in shades of yellow. Land cover can be seen through the airmasses in blue.


The locations of the moist and dry air masses are verified by looking at Airmass RGB imagery, shown in Figure 3. On this satellite imagery, the warm, moist air mass can be seen by the green coloring. Dry air is shown in orange, and lower stratospheric air (indicating the location of the jet stream) is shown in dark orange. Cloud top temperatures are shown by the white regions. There is a warm, moist air regime over much of the Southeast. The developing convection is shown clearly by the intense white coloration of the cells popping up. There is a dry streak over the Gulf of Mexico, indicating a jet stream signature in the vicinity, moving towards Florida.


Figure 3 Airmass RGB imagery from GOES-16, valid beginning 2200 UTC 14 April 2021 (5pm local time). Warm, moist airmasses appear in the green coloration. Dry airmasses appear in the lighter orange coloration. Dry, highly stable air (advected from the stratosphere) appear in the dark orange/red coloration. Cold, dry (polar) airmasses appear in the dark blue/indigo coloration.


Finally, the information gathered from various satellite products can be verified by referring to radar imagery. Base reflectivity in Figure 4 shows the highest dBZ values located east of Houston. This corresponds to the areas of most intense precipitation. The regions with the highest dBZ values also raise concern for hail formation. By referring to other radar products (such as correlation coefficient imagery and differential reflectivity imagery, not shown here), hail does not appear to be forming with these storm cells. The cells show a clear core and gap structure as well, so there is concern for the formation of cold pools that may drive more local upward vertical motions.


Figure 4 Base reflectivity from KHGX (Galveston, Texas), valid beginning at 0000 UTC 15 April 2021 (7pm local time). The highest reflectivity values (in dBZ) are shown in the red/orange colors. These correspond to the regions experiencing the heaviest rainfall.


Though these storm cells rapidly appeared over the South, there was little impact from their formation. They ended up bringing rain to eastern Texas and southern Louisiana in a classic diurnal heating set up. This event brought a taste of what’s to come in this region over the next few months of late spring and summer!

Blog Post 2 (author: Thomas Silas)

The second full week of April 2021 was the first week in quite some time that no major severe weather outbreak was forecast for the southeastern United States. That said, though, interesting weather did occur in the US, including some significant precipitation over the Intermountain West region. This can be seen on a radar reflectivity image from the afternoon of Wednesday, April 14:


Figure 1: NEXRAD radar reflectivity over Utah and southwest Wyoming, 1945Z 14 April 2021 (source: College of DuPage)


Two distinct areas of precipitation can be seen affecting northern Utah: a stratiform region stretching from eastern Utah to southeast Idaho, and a convective line over western Utah. While radar reflectivity alone does not directly distinguish between rain and snow, snow tends to appear much smoother on maps of this type, while rain echoes are better defined with sharper edges. In addition, reflectivity values tend to be higher for rain than for snow. Based on these characteristics, some of the precipitation in the first stratiform region appears to be in the form of snow, especially in the northwest Utah/southern Idaho border areas. However, most locations only experienced rain, with snow limited to areas of higher terrain. This is likely due to the tendency for the radar beam to increase in elevation with distance from the radar. In addition, many radar sites in the western US are placed on top of hills or mountains in order to see over nearby terrain, enhancing this elevation effect. Precipitation is probably falling through the radar beam as snow, but melting before it reaches the surface. This is confirmed by a map of surface observations from 2200 UTC (1600 MDT) that afternoon, which shows temperatures well above freezing (40s-50s F) in the valley regions.


Figure 2: Surface observations, 22Z 14 April 2021. (source: UW-Madison AOS Department)


Significant snow did fall in the mountains, with some locations seeing well over a foot of accumulation. However, perhaps more interesting was the convective line that formed behind the earlier round of stratiform precipitation. At 2030 UTC, this line extended from the southern end of the Great Salt Lake southward through Salt Lake and Utah Counties as seen on the radar image below. This may not technically qualify as a squall line or mesoscale convective system (MCS) since the area covered was not large and the system was relatively weak. However, a shelf cloud and gusty winds over 40 mph were observed with much of the line, and a few stronger cells can be seen within it – especially the one over northwestern Utah County. That particular cell produced half-inch diameter hail in addition to frequent thunder and lightning.


Figure 3: NEXRAD base reflectivity from KMTX radar site, approximately 2030Z 14 April 2021. (source: College of DuPage)


Interestingly, surface temperatures were only in the mid 40s at the time. Although thunderstorms are unusual with temperatures this low, they are not unheard of if other atmospheric conditions are right. This can be seen from the 0000 UTC sounding from Salt Lake City later that evening: the surface temperature was only 44F, but mid-level temperatures were cold enough to result in some weak instability – around 250 J/kg of CAPE (Convective Available Potential Energy). While this is not a lot and is too low for any significant threat of severe weather, it was clearly enough to allow for the scattered thunderstorms observed Wednesday afternoon across northern Utah.


Figure 4: 00Z 15 April 2021 sounding from Salt Lake City. (Source: Storm Prediction Center)

Blog 2 (author: Laurel Freeman)

The focus on April 8th, 2021 in the meteorological realm was an extratropical cyclone over the Midwest. There were four satellite images that were observed in class. These will be broken into two figures so the images will be larger and still comparable. The mid-level water vapor channel on GOES-16 shows dry air wrapping around and into the cyclone in a comma shape from North Dakota south and east all the way to Alabama and back north and west into Missouri at the center. The darker shades are dry air, and the whiter shades are moist air and higher cloud tops if they are very bright. Similarly, the airmass RGB has an orange rust color stand in for dry air where green air is moister. White is clouds, with brighter whites being higher cloud tops. The dry air intrusion at mid-level helped strengthen the cyclone by enhancing sinking of cold air and maintaining the updraft of warm air.


Fig. 1: (top panel) A mid-level water vapor satellite image where dark shades are dry air and light shades are moist air (source: https://whirlwind.aos.wisc.edu/~wxp/goes16/wv/goes16_namer.html) from 08 April 2021 at 1350 UTC, and (lower panel) is an airmass RGB satellite image from 08 April 2021 at 1400 UTC where rust is dry air, green is moist air, blue is colder air, and purple at the corners is limb effects (not accurate data). (source: https://weather.cod.edu/satrad/?parms=continental-conus-airmass-24-0-100-1&checked=map&colorbar=undefined)


The day cloud phase RGB at the top of Figure 2 is not useful at night (all the clouds turn red) but is useful for differentiating between types of clouds and snow during the day. The center of this cyclone is teal, meaning it has liquid water-based clouds. The northwest sector of the cyclone (the Dakotas and all of Minnesota) as well as the southeast sector of the cyclone (parts of Alabama, Georgia, and Florida) all have orange and yellow shades, which indicate higher cloud tops and convection. The bottom of Figure 2 shows the simple water vapor channel, where black represents dry air and light to white blues indicate intense convection and precipitation. Looking at Figure 2, as well as both the water vapor and airmass RGB channels, the heaviest precipitation looked to be over the panhandle of Florida. Figure 3 was radar reflectivity at the time, and it confirmed what the satellites displayed. Moisture being advected from the Gulf of Mexico likely helped the southern edge of the cyclone be more intense.


Fig 2: (top panel) A day cloud phase satellite image where teal clouds are liquid water drops, yellow and orange clouds are higher cloud tops, and red clouds are still under the terminator (source: https://weather.cod.edu/satrad/?parms=continental-conus-dcphase-24-0-100-1&checked=map&colorbar=undefined), and (lower panel) is a simple water vapor satellite image with black being dry air and bright blue whites being higher cloud tops with indication of convection. (source: https://weather.cod.edu/satrad/?parms=continental-conus-simplewv-24-0-100-1&checked=map&colorbar=undefined) Both are from 08 April 2021 at 1400 UTC.


Figure 3: A radar reflectivity image in dBZ from 08 April 2021 at 1400 UTC. The strongest precipitation is over the Florida panhandle as indicated on the side color bar. (source: https://weather.cod.edu/satrad/?parms=continental-conus-comp_radar-24-0-100-1&checked=map&colorbar=undefined)


Finally, looking ahead to 0000 UTC on 2021 April 09, there is a small risk for tornadoes as the rest of the southern part of the system makes its way across the Southeast. The sounding from Tallahassee (KTLH) on the left of Figure 4 shows an opportunity for a process known as forcing. Forcing is when an air parcel, if moved higher up into the atmosphere, remains cooler than its environment but keeps rising if something forces it upward into the atmosphere. The right part of Figure 4 shows convective available potential energy (CAPE) values high enough for tornadoes to form. This is coupled with directional and speed wind shear, which is when the wind changes direction and speed as it moves upward into the atmosphere, which could induce rotation. The Storm Prediction Center put out a 2% risk for tornadoes over parts of the Southeast today for this reason.


Figure 4: (left panel) A sounding taken on 08 April 2021 at 1200 UTC. The brown dotted line is the path an air parcel would take, the red line is the environmental temperature, and the green line is dew point temperature. Because the brown line is to the left of the red line, an air parcel would be cooler than the environment were it to rise, creating a situation where the parcel would have to be forced upward by a mechanism if it were to move because cool air tends to sink. (source: https://www.spc.noaa.gov/exper/soundings/21040812_OBS/). (right panel) A map showing convective available potential energy (CAPE) in J/kg (fill pattern) wind speed and direction at 10 m, 850 mb, and 500 mb, (white, green, and yellow, respectively) in kts.

Blog Post 2 (author: Sydney Hopkins)

On March 31 00Z, a broad area of low pressure can be seen centered over North Carolina and Virginia moving eastward (Figure 1). The low-pressure system, with cyclonic circulation, is producing an associated cold front that runs down the southeast, oriented southeast to northeast. Further northward, another low-pressure system can be observed just north of Maine producing an associated cold front that runs down the east coast appearing to almost connect with the front further south. The combination of these low-pressure systems and their associated fronts are producing precipitation and storms up and down the east coast. The pressure gradient does not appear to be very strong, indicating milder storms and weather.

Figure 1: Surface Analysis, April 1 00Z


The system in focus can be seen moving over the east coast of the US in the infrared image below, taken on March 31 23Z. The whitest shades of the image can be seen over Georgia and the Carolinas. These white shades indicate cold cloud temperatures, which usually correspond to higher clouds with associated convection and storms (Figure 2). On the radar image below, taken shortly after on April 1 01Z, highest reflectivity can be seen over Georgia and the Carolinas, corresponding to the whitest regions on the infrared image. These areas of high reflectivity indicate high levels of precipitation (Figure 3).


Figure 2: Infrared Satellite Image, March 31 23Z


Figure 3: Radar Image, April 1 01Z


In figure 4 below, showing 250 hPa windspeeds and 500-1000 hPa thickness, the low-pressure system centered over North Carolina appears to be in the right entrance region of the jet. This is an area of positive vorticity advection, which results in upward vertical motion and is favorable for the strengthening of extratropical cyclones. This would suggest our system should continue to strengthen as it moves off the east coast. Additionally, the lows can be observed to be centered in a region of an upstream trough and downstream ridge (Figure 5). This is an area with ageostrophic divergence, which results in upward vertical motion and is favorable for the intensification of the cyclonic system being discussed. The highest areas of divergence and upward vertical motion can be seen in figure 5 along the southeast coast.


Figure 4: 1000-500 hPa thickness, 250 hPa wind speed, April 1 00Z


Figure 5: 300-200 hPa PV, irro. Wind, 600-400 hPa ascent, April 1 00Z


This low-pressure system will continue to produce precipitation along the east coast throughout the day on April 1. The 12-hr. precipitation probability map shows moderate probability of rain along the east coast (Figure 6). This precipitation should not be associated with too much severe weather activity. Figure 7 shows that only low levels of CAPE can be observed over Florida and southeast Georgia. This indicates a lower probability for intense storms associated with this system.


Figure 6: 12 hr. probability of precipitation, April 1 00Z


Figure 7: 850 hPa heights, temp, CAPE, 1000-500 hPa shear, April 1 00Z